A public mid-density genotyping platform for cultivated blueberry (Vaccinium spp.)
Abstract
Small public breeding programmes have many barriers to adopting technology, particularly creating and using genetic marker panels for genomic-based decisions in selection. Here we report the creation of a DArTag panel of 3,000 loci distributed across the tetraploid genome of blueberry (Vaccinium corymbosum) for use in molecular breeding and genomic prediction. The creation of this marker panel brings cost-effective and rapid genotyping capabilities to public and private breeding programmes. The open access provided by this platform will allow genetic data sets generated on the marker panel to be compared and joined across projects, institutions and countries. This genotyping resource has the power to make routine genotyping a reality for any breeder of blueberry.
Keywords
Vaccinium spp., amplicon-sequencing, plant breeding, DArTag genotyping, microhaplotype
Introduction
Molecular techniques have been employed for nearly four decades to enhance and speed the breeding efforts for major staple food crops like tomato, maize and barley ( (Feuerstein, Brown, & Burdon, 1990; Helentjaris, King, Slocum, Siedenstrang, & Wegman, 1985; Tanksley, 1983) and reviewed in (Hasan, Choudhary, Naaz, Sharma, & Laskar, 2021)). Over time, molecular biology techniques have been paired with high-quality phenotypic data to perform genome-wide association studies (GWAS), genomic selection and prediction, further fuelling breeding for quantitative or complex traits (Eathington, Crosbie, Edwards, Reiter, & Bull, 2007; Heffner, Sorrells, & Jannink, 2009; Lorenzana & Bernardo, 2009). While these achievements are significant, many crop species grown for human consumption are still unable to apply these techniques in breeding efforts. Many breeders would like to adopt molecular breeding tools and techniques, but sometimes doing so is hampered by large barriers-to-entry challenges. The range of barriers, and how surmountable they are, varies from species to species and is impacted by species-specific challenges in logistics, technical know-how, biology and the growing environment.
Blueberries (Vaccinium spp) are native to North America and are a relatively recent crop, having been cultivated only since 1916 (USHBC, 2021). The United States (US) is the largest global producer of blueberries (FAOSTAT, 2021). In 2022, the US produced over 282 million kilograms (622 million pounds) of cultivated blueberries and harvested 35.2 million kilograms (77.6 million pounds) of wild blueberries, which amounted to a total crop value of USD1.04 billion (NASS, 2023). Blueberries are considered a ‘superfruit’ for human nutrition due to their high levels of essential nutrients, fibre and antioxidants. Because of their nutritional value, blueberries are produced for a wide range of markets including fresh eating (and U-pick), frozen whole berries, frozen juice, powders and dried leaves for herbal tea.
Cultivated blueberries are categorized by growing region and chilling requirements. In Northern states, most varieties are Northern highbush types (NHB; V. corymbosum) that only flower after about 800–1,000 hours of exposure to temperatures between 0°C–7°C (32°F–45°F) (Hancock, 2009). The Southern highbush types (SHB) are complex hybrids between V. corymbosum with the evergreen species V. darrowii native to Florida. Southern highbush varieties have reduced chilling requirements (200–300 hours) and enhanced adaptation to Southern climates and soils (Hancock, 2009). The half-high blueberry (HHB) is derived from crosses between NHB with V. angustifolium, a wild Northern species. Half-high blueberry is preferred for commercial environments that require varieties with enhanced hardiness. Unlike NHB, SHB and HHB which are tetraploid types, the fourth cultivated type, rabbiteye (RE; V. virgatum), is hexaploid. Rabbiteye blueberry, known for its high vigour and heat tolerance, is native to the Southeastern US (Edger et al., 2022). Although most of the breeding efforts are focused on these four cultivated types, some pre-breeding work has included parents from wild species (also known as lowbush blueberry) of the Cyanococcus section of the subgenus Vaccinium.
Blueberry breeding is a long and tedious process (Gallardo et al., 2018). Traditional breeding approaches can take 9 to 20 years from crossing and testing to the release of new cultivars (Gallardo et al., 2018). Some of the breeding challenges are that cultivated blueberries are perennials, outcrossing, highly heterozygous and autotetraploid, where random chromosome pairing during meiosis predominates (Lyrene, Vorsa, & Ballington, 2003; Qu & Hancock, 1995; Qu, Hancock, & Whallon, 1998). Traditional biallelic SNP marker systems designed for inbred or diploid species often fall short when applied to heterozygous and polyploid species due to their inability to identify multiallelic dosages accurately. A more sophisticated genotyping system is needed to address the unique challenges posed by blueberry’s autotetraploid nature, yet the investment cost and reliance upon skilled bioinformatics support for each genotyping run make this a high-risk endeavour for breeders.
The first and most tractable place to build capacity and tools for molecular breeding is to create a rapid genotyping pipeline that fits within both the breeding and selection cycles and can deliver on the breeder’s objectives (Hawkins & Yu, 2018; Mejia-Guerra, Zhao, Sheehan, Yu, & Kole, 2021) . As stated here, a pipeline refers to a complete workflow starting with a genetic marker platform, vendors for services and bioinformatic tools to transform returned raw data into a usable format for breeders. There are several factors to consider when choosing a genetic marker platform: cost per data point, vendor services, turnaround times and what genetic analyses can be done with the resulting data. For blueberry, we hypothesized that a targeted-amplicon sequenced-based approach would be the most beneficial for breeders. Unlike Genotyping-by-Sequencing (GBS), targeted amplicon-based genotyping technologies such as DArTag (Diversity Array Technology - DArT), Flex-Seq (RAPiD Genomics), and Capture-Seq (LGC Genomics) have low missing data rates and query the same loci in all samples across genotyping projects, allowing new data to be easily appended to existing data (Darrier et al., 2019; Telfer et al., 2019; Wang et al., 2020). The amount of data returned is in the tens of thousands or less, rather than the millions of reads from GBS, simplifying downstream bioinformatics processing (Darrier et al., 2019; Milner et al., 2019). This in turn speeds up the analysis time for marker-assisted selection (MAS), introgression tracking, linkage mapping, GWAS and genomic prediction (Darrier et al., 2019).
Here, we report the creation of a mid-density DArTag panel of 3,000 marker loci distributed across the blueberry genome for use in molecular breeding and genomic prediction. DArTag is a hybridization/amplicon-based targeted genotyping platform developed by DArT (Blyton et al. (2023); https://www.diversityarrays.com/services/targeted-genotying/) available to the public.
Materials and methods
Germplasm selection and whole-genome sequencing of a blueberry diversity panel
A total of 31 cultivated blueberry accessions focused on elite North American breeding lines were selected for skim sequencing. This panel consisted of 12 NHB, 10 SHB, 2 NHB x SHB hybrids, 5 RE, and 1 RE x SHB accessions (Supplemental Table 1, entries marked with asterisks). Two biological replicates of each sample in the discovery panel were processed, where the sequencing libraries (average insert DNA size of 300bp) were prepared using either Illumina Nextera WGS library prep at the Genomics Facility of Cornell Institute of Biotechnology or NEBNext Ultra DNA Library Prep Kit at Novogene. Whole-genome sequencing was done using Illumina NovaSeq 6000 at Novogene (https://en.novogene.com).
SNP discovery and selection of 3K marker loci for building DArTag genotyping panel
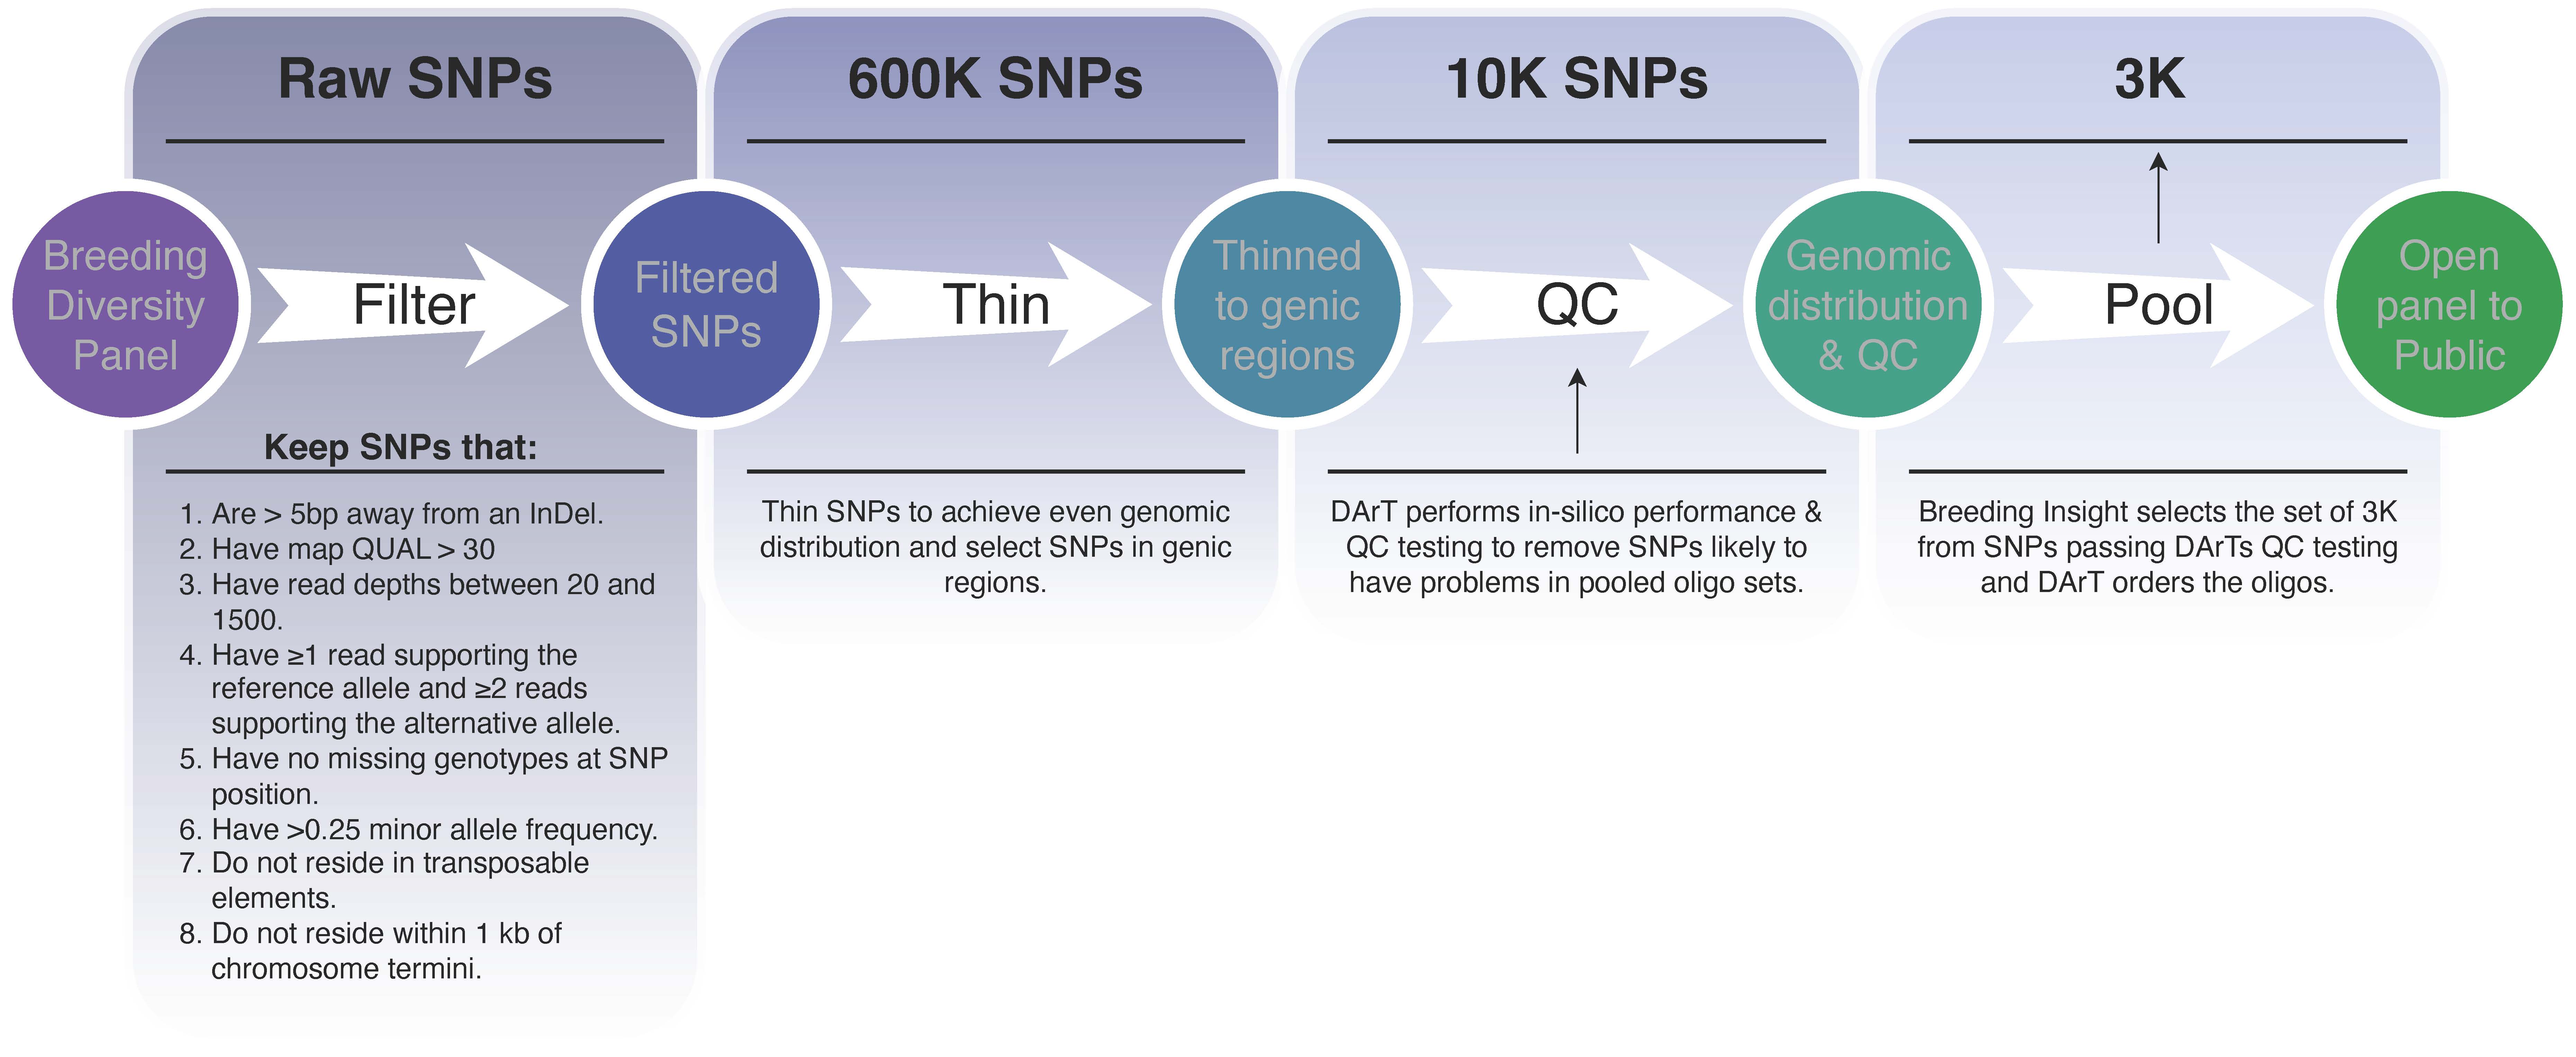
Raw FASTQ sequences were processed by removing residual adapter sequences and low-quality bases using Trimmomatic (LEADING:10 TRAILING:10 SLIDINGWINDOW:4:15 MINLEN:30) (Bolger, Lohse, & Usadel, 2014). Cleaned reads were then aligned to the haploid set (i.e., the first set out of the four homologous chromosomes) of the blueberry reference genome as described by (Colle et al., 2019) using BWA-MEM (Li, 2013). Structural variants (SNPs and indels) were called using the DNAseq pipeline developed by Sentieon (https://www.sentieon.com). A total of 600K SNPs were discovered in the diversity panel. A high-confidence set of 10K SNPs (Figure 1) was then identified using the following criteria: (1) not located within 5bp from an indel, (2) QUAL > 30, (3) minimum and maximum read depths of 20 and 1,500, respectively, (4) at each heterozygous site, at least one read supporting the reference allele and two reads supporting the alternative allele, (5) no missing genotype per SNP position, (6) with a minor allele frequency greater than 0.25, (7) not located in transposable elements or within 1Kb of chromosome termini and (8) even genomic distribution and mostly located in genic regions. The 10K SNPs were submitted for QC to DArT (Diversity Arrays Technology Pty Ltd, www.diversityarrays.com), from which a 3K SNP set was selected. Additionally, a few experimentally validated SNPs were also force-included in the panel.
Custom oligo probes were then synthesized, and genotyping was done at DArT. A total of 1,445 and 1,555 marker loci (Supplemental File 1) were designed to produce amplicons from the plus and minus strands based on the reference genome, respectively (Colle et al., 2019). Based on the ‘Draper’ reference genome and gene assembly v1.0 from (Colle et al., 2019), 97% (2,924) reside in genic regions, with only 3% (76) residing in non-genic regions (Supplemental File 1). Among the 3,000 loci selected, each chromosome harbors between 219 loci on Chr07.1 to 296 loci on Chr02 with an average of 250 loci per chromosome. In addition, there is a positive correlation (R2=0.70) between the number of genes on a chromosome and the number of targeted loci on that chromosome, indicating that chromosomes with more genes have better marker coverage (Supplemental File 1). The DArTag genotyping technology produces multi-allelic data as 54bp and 81bp amplicons (referred to as microhaplotypes in this study) encompassing the 3K target SNP sites, therefore, we refer to these target sequences as marker loci.
Selection of samples for validating the DArTag panel and genotyping results
The DArTag genotyping assay consists of four steps based on principles described in (Krishnakumar et al., 2008) and implemented as described in (Zhao et al., 2023). Briefly, the pool of 3,000 blueberry oligos, each targeting one genetic variant plus adjacent flanking sequence, is hybridized to denatured gDNA in step 1, followed by SNP/INDEL copying into DArTag molecules by DNA polymerase in step 2. After ligation into circular molecules also in step 2, and nuclease treatment to remove uncircularized molecules in step 3, DArTag products are subsequently amplified in step 4 with the simultaneous addition of sample unique barcodes used downstream for demultiplexing. The products of DArTag assay, after purification and quantification, are sequenced on NGS platforms (e.g. NovaSeq 6000, Illumina) with a depth of around 200x, demultiplexed and the genetic variants are detected using the DArT proprietary analytical pipeline.
The blueberry 3K marker panel was tested using a set of 375 samples, including: (1) a diverse set of cultivated blueberries (n = 171), (2) a ‘Draper’ x ‘Jewel’ (DxJ) F1 population (n = 175), (3) wild Vaccinium species and other interspecific hybrids (Vaccinium subgenus) (n = 24), and (4) a small number of cultivated cranberry varieties (n = 5) (Oxycoccus subgenus) (Supplemental Table 1). The raw genotyping data included FASTQ and the missing allele discovery count (MADC) file (Supplement File 2).
The MADC file was first filtered at the microhaplotype level. A microhaplotype was retained if it was present in at least 10 samples and each sample had at least 2 reads detected. First, samples with ≥ 95% missing data were removed. Then, filtering of marker loci was based on ≥ 10 samples with each having ≥ 10 reads for each marker locus per sample. All SNPs, including both target and off-target SNPs were extracted from all remaining marker loci for downstream analyses. Principal component analysis was conducted using read count data from all samples using AddPCA function in polyRAD (Clark, Lipka, & Sacks, 2019) and plotted using ggplot2.
Genetic map construction
The DxJ F1 population was derived from a ‘Draper’ x ‘Jewel’ cross. ‘Draper’ is a NHB variety released by Michigan State University in 2004, whereas ‘Jewel’ is a SHB variety released by the University of Florida in 1999. The true parental plants that were used to make the DxJ cross are no longer available, so we genotyped five Draper accessions and five Jewel accessions from across several public programmes. Genotype dosage calls for each SNP in the DxJ population were determined with updog software (Gerard, Ferrão, Garcia, & Stephens, 2018). A PCA was performed in polyRAD and identified 14 DxJ progenies that do not appear to be true F1s (Supplemental Figure 1A). Before mapping, these 14 individuals were removed leaving 161 DxJ F1 progeny and the most similar parents to the true parents, which were not available, ‘Draper_2004.001_S10-42’ and ‘Jewel_2157.001_G04-01’ were identified as proxy parents. (Supplemental Figure 1B). Of the 8,955 SNPs detected, 4,918 were non-informative in the DxJ F1 population and were removed from further mapping on the ‘true’ 161 F1s in the DxJ population. The average missing data for this population was 15% (range 6–26%) (Supplemental Figure 2). Marker loci with > 5% missing rate (n = 840), and that did not fit expected Mendelian segregation (n = 1,203) were also removed from further analysis leaving 1,994 markers available for map construction. To construct the F1 population genetic map MAPpoly2 was used (https://github.com/mmollina/mappoly2; Mollinari and Garcia (2019); Mollinari et al. (2020)). A recombination fraction matrix was calculated and used to cluster the markers into linkage groups. Screening SNPs based on recombination frequency via the rf_filter function eliminated additional SNPs (n = 497). For each linkage group, genomic order (physical position) of the markers was used to perform phasing and generate the genetic map. The construction of the genetic map involved initially creating individual maps for each parent, which were then integrated into a comprehensive HMM model using the merge_single_parents_maps function, resulting in a consolidated map. Additional unmapped markers were incorporated using the augment_phased_map function, which adds markers with redundant map information. The final F1 genetic map was constructed with 1,301 unique (1,487 total) markers (Supplemental Figure 3B). Lastly, the haplotypes of the F1 individuals were reconstructed by employing genotypic conditional probabilities through the calc_homoprob function (example shown in Supplemental Figure 3C).
Results
Validation of the 3K blueberry DArTag panel and genotyping results
To assess the quality and completeness of data, a validation set of 375 samples was genotyped using the 3K DArTag panel to (1) assess diversity among cultivated blueberries, (2) construct a genetic linkage map, and (3) evaluate its usefulness across species and subgenera.
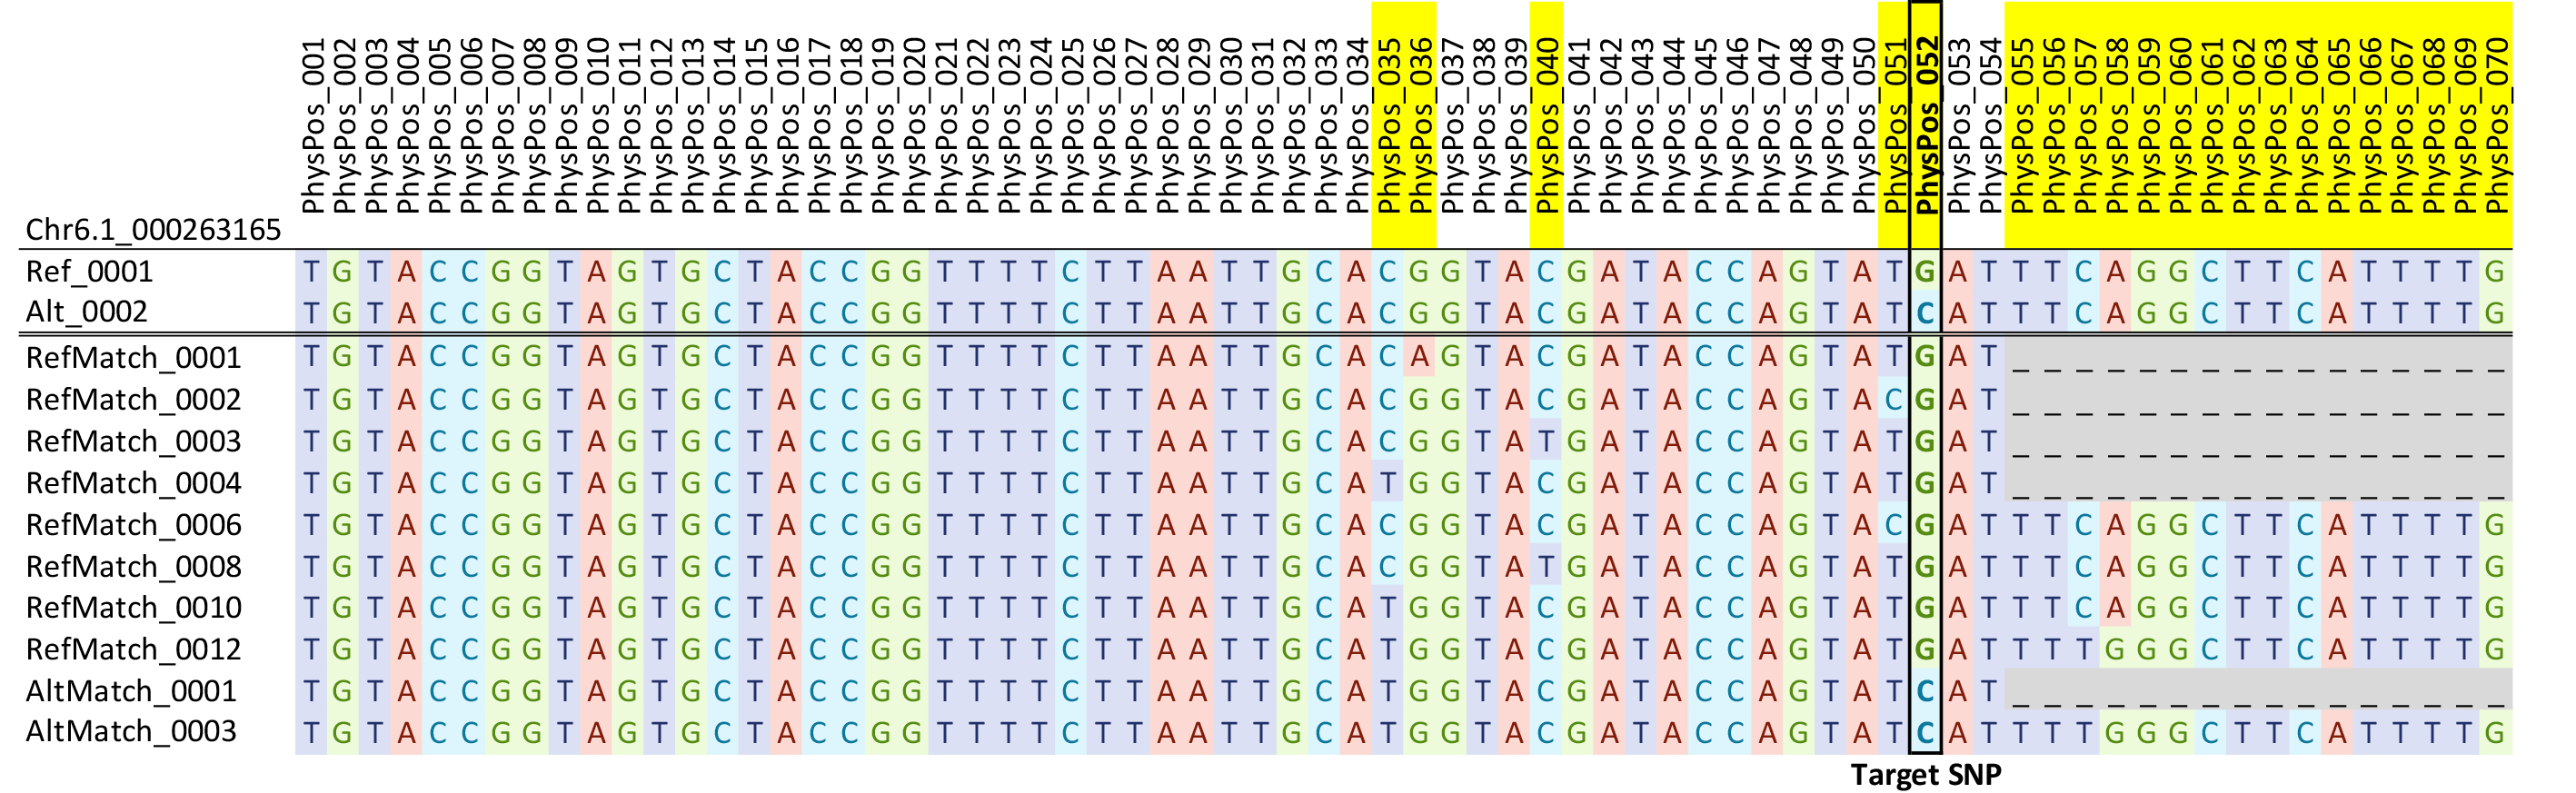
DArT generates genotyping results in several formats, among which the MADC format (missing allele discovery count) provides all the microhaplotypes (54–81bp) discovered based on amplicons for the 3K marker loci. These microhaplotypes contain target SNPs per assay design as well as off-target SNPs, which are present in flanking amplicon sequences. To better distinguish these microhaplotypes, those matching the reference and alternative alleles at the target SNP site and containing no other variant nucleotide are denoted as Ref and Alt microhaplotypes, respectively. Additional haplotypes that contain off-target SNPs in variant nucleotides in the flanking sequences are denoted as RefMatch (when target SNP matches Ref) and AltMatch (target SNP matches Alt) with consecutive numbering for uniqueness (Figure 2). The MADC report (Supplemental File 2) was filtered at the microhaplotype level by requiring at least 5% of total samples, each having a minimum of 2 reads to retain a RefMatch or AltMatch. Out of 16,340 RefMatch and AltMatch, 8,370 were filtered out due to high missing data and 7,970 remained.
Panel effectiveness in extant accessions
The marker loci detection rate was determined at both sample and marker levels, respectively. All 375 samples contained data from ≥ 25% marker loci, therefore, no samples were removed. About 95% (n = 355) of total samples have data from ≥ 75% marker loci, indicating the high detection efficiency of the marker panel. At the marker level, data presence ranged from 5% to 100% in samples. It is worth noting that 1,722 (57%) marker loci were detected in ≥ 95% of samples and 299 (10%) marker loci were detected in all the samples surveyed, representing the most conserved marker loci in the blueberry genome and its related species. A total of 101 marker loci with data in < 5% of total samples were excluded for downstream analyses. The average missing data for each cultivated blueberry type was as follows: 19% for NHB (range 8–24%), 18% for SHB (range 13–26%), 20% for HHB (range 18–21%), and 21% for RE (range 17–24%) (Supplemental Figure 2). Wild species from the Vaccinium subgenus had a missing data rate ranging from 18–56% (Supplemental Figure 2), whereas the five cranberry samples (Oxycoccus subgenus) exhibited the highest missing rates ranging from 54–73%. Marker loci that worked across subgenera are likely linked to conserved regions of the blueberry and cranberry genomes.
Creation of a linkage map
A bi-parental population of ‘Draper’ (NHB) and ‘Jewel’ (SHB) (DxJ) was genotyped to test if the 3K DArTag panel can be used to generate a linkage map. The population was created by Michigan Blueberry Grower Marketing and clones of the parents, ‘Draper’ and ‘Jewel’, were distributed widely to researchers and growers nationwide. The true parents of the DxJ population were not available to be genotyped so we genotyped five different samples of both ‘Draper’ and ‘Jewel’. Genetic evidence supported that ‘Draper_2004.001 S10-42’ and ‘Jewel_2157.001_G04-01’ were close proxies for the true parents (see Materials and Methods; Supplemental Figure 1).
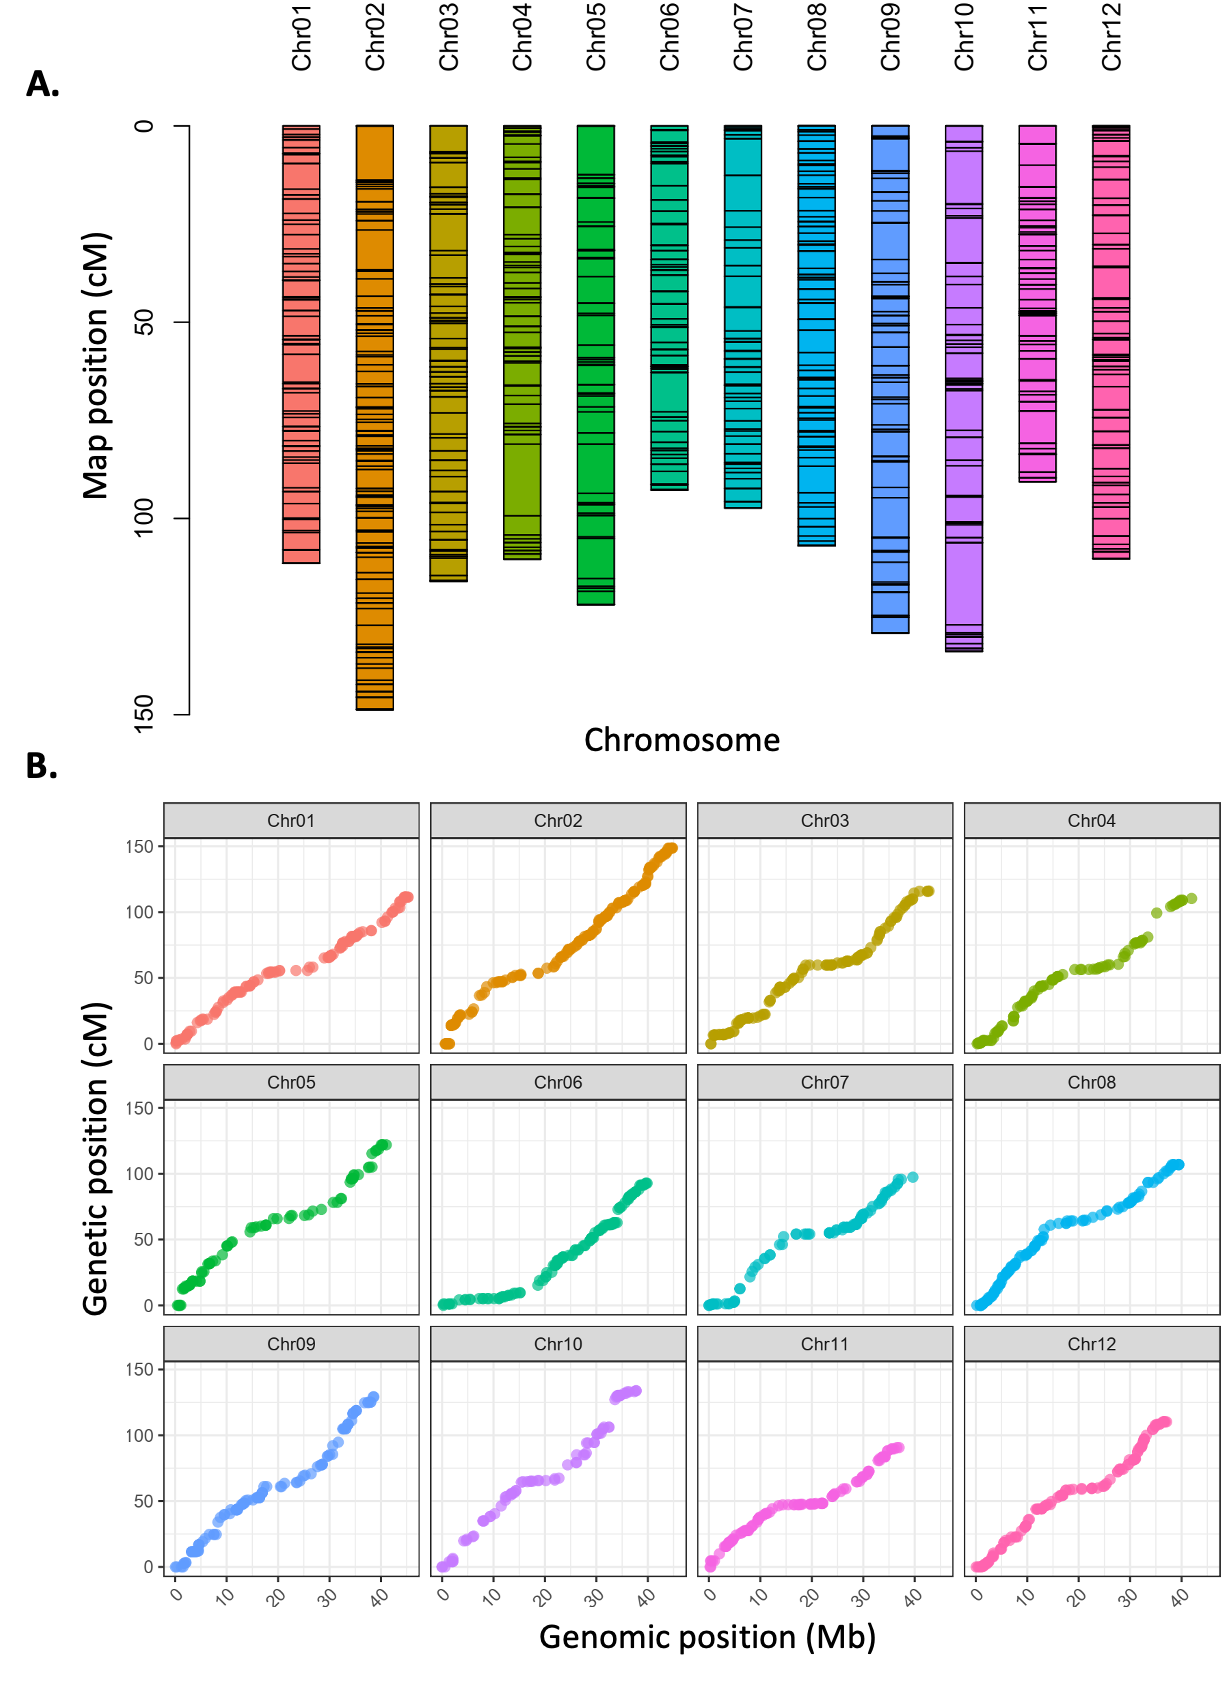
The final DxJ F1 linkage map consisted of 12 linkage groups with 1,301 markers and a total length of 1,368.6cM (average density of 0.96 markers/cM) from 161 progeny (Figure 3; Supplementary Figure 3). Linkage group length ranged from 90.50cM to 148.30cM, with an average of 114.05cM. Markers were well distributed throughout the 12 linkage groups. Supplemental File 3 contains linkage groups with marker order, positions in cM, and parental phasing. Additionally, haplotypes (indicating recombination events) for all individuals in F1 population were reconstructed (Supplemental Figure 3C) based on the genotypic conditional probabilities.
Discussion and conclusion
The blueberry DArTag panel is now publicly available and open for any researcher or breeder to order through DArT (https://www.diversityarrays.com). The panel was designed on the legacy technology to produce 54bp reads but worked equally well with the current technology (81bp reads) with the caveat that some residual adapter sequences may be included (read-through of the entire fragment into the adapter). Raw data in FASTQ can be requested as can the Missing Allele Discovery File (MADC) that indicates the read depth of each microhaplotype in each sample. The high detection rate and repeatability make this panel suitable for genetic map construction, marker-assisted selection, whole-genome association mapping, reconstruction of recombination patterns, allele dosage estimation and parental confirmation in North American cultivated NHB, SHB, RE, and HHB, with some limited application in other Vaccinium species. The efficacy of the panel on breeding materials outside of North America has not been tested at this time.
The DArTag assay can be processed from blueberry gDNA or leaf tissue to genotyping data extraction in a 3–4-week turnaround time. The DArT genotyping data report comprises allele dose calls and raw data with custom report formats available upon request. One benefit that DArTag has over fixed array platforms is the ability to update and improve the marker panel as required over time. The panel is a pool of 3,000 oligos, one per locus, which is used to generate the sequencing libraries from the assayed material. Because the pool is created from individual oligo stocks, the removal of suboptimal loci or the addition of new loci can be easily done by creating a new pool. To determine which loci should be considered for removal, extensive genotyping (> 10,000 samples) is underway to identify and remove those loci that consistently underperform or fail. Independently, as new significant QTL markers and/or markers specific to other germplasm are detected, they can be targeted for inclusion in the original pool in the next version(s) of the panel. DArT offers re-pooling services once per year at low or no cost, but more frequent requests could result in labour surcharges being applied (Andrzej Kilian, personal communication). Researchers interested in initiating projects with DArT are encouraged to contact DArT directly for consultation.
Another benefit of genotyping using the blueberry 3K DArTag panel is the ability to detect and catalogue all microhaplotypes into a fixed allele database, which will improve combining data sets across genotyping projects (manuscript in preparation). If after testing on thousands of samples, there are too few markers for GWAS for a given trait of interest, additional DArTag panels can be made to complement this panel, or larger platforms like the Flex-Seq 22K panel (Flex-Seq Panel Code: FS_1903) from RAPiD Genomics could be utilized (Nahla Bassil, personal communication). Another option is to add the required loci to the existing panel up to the technical limit of 7K, which is a more cost-effective option for the routine genotyping service with scalability.
We chose to create a panel of 3,000 marker loci due to cost and technical reasons, but smaller complementary panels can be made at lower up-front and downstream usage costs. The practical upper limit for the maximum number of probes on a DArTag panel is 7,000 loci, though the optimal maximum may differ by species and genome complexity, and read depth required to sufficiently call genotypes (Andrzej Kilian DArT, personal communication). The blueberry breeding community could decide to create a complementary 3K panel to result in more detailed genotypic data, however, this would nearly double the cost of genotyping per sample.
Data availability statement
The FASTQ files from the whole-genome skim sequencing for the 31 blueberry accessions used for identifying the candidate SNP variants are housed in the NCBI Short Read Archive under the BioProject ID PRJNA1020150. The targeted regions used to create the 3K DArTag markers are available on DRYAD (pre-publication URL: https://datadryad.org/stash/share/UeW2RMVU2bbxTKm0SBMuKp6VJVFshE72Um9maVAKqjA ; DOI: 10.5061/dryad.j6q573nnc)
Supplemental data
Supplemental Table 1. Accessions used in the construction and testing of the blueberry 3K DArTag panel
Supplemental Figure 1. Principle Component Analysis (PCA) plots of the ‘Draper’ x ‘Jewel’ F1 population
Supplemental Figure 2. Missing data rates for different grouped subsets of genetic material
Supplemental Figure 3 . Blueberry Genetic map construction for the F1 population
Supplemental File 1. Genomic information of the blueberry 3K DArTag marker panel
Supplemental File 2 . MADC report for the 375 samples used to validate the 3K DArTag panel
Supplemental File 3. Linkage group with their marker order, positions in cM, and parental phasing information where P1 represents ‘Draper’ and P2 represents ‘Jewel’.
Acknowledgements
Breeding Insight is acknowledged for project design, marker development, curation and data processing. Diversity Arrays Technology created the oligo array, provided sequencing services and contributed to the manuscript. We thank Chad Finn, Nahla Bassil, Ebrahiem Babiker, Massimo Iorizzo and Mark Ehlenfeldt for providing germplasm. We also thank Alexandra Casa and Sharon Mitchell for careful reading and revision of the manuscript. Breeding Insight was funded for this work through Cooperative Agreements between USDA-ARS and Cornell (project numbers: 8062-21000-043-004-A, 8062-21000-052-002-A, and 8062-21000-052-003-A).
Marcelo Mollinari was funded by a USDA NIFA-awarded AFRI grant (project number: 2022-67013-36269).
Author contributions
DZ, NB, and MJS contributed to experimental design and planning. DZ, NB and MJS selected the diversity panel for WGS. NB collected and prepared all plant materials used in the study. DZ performed all the WGS analyses, SNP database creation, filtering pipelines, and quality control analyses to create the 3K panel. KHU managed the panel creation at Diversity Arrays Technology. DZ, MS and MM executed the data analyses and genetic mapping. MFG and MI assisted with ‘Draper’ and ‘Jewel’ parental identification. DZ, MS and MJS wrote the initial draft of the manuscript. CB managed experiments and communication among all authors involved. All authors contributed to reviewing the manuscript.
Conflict of interest statement
The authors have no conflicts of interest to report.