Combined cytogenetic and molecular methods for taxonomic verification and description of Brassica populations deriving from different origins
† These authors contributed equally to this work
Abstract
Agriculture faces great challenges to overcome global warming and improve system sustainability, requiring access to novel genetic diversity. So far, wild populations and local landraces remain poorly explored. This is notably the case for the two diploid species, Brassica oleracea L. (CC, 2n=2x=18) and B. rapa L. (AA, 2n=2x=20). In order to explore the genetic diversity in both species, we have collected populations in their centre of origin, the Mediterranean basin, on a large contrasting climatic and soil gradient from northern Europe to southern sub-Saharan regions. In these areas, we also collected 14 populations belonging to five B. oleracea closely related species. Our objective was to ensure the absence of species misidentification at the seedling stage among the populations collected and to describe thereafter their origins. We combined flow cytometry, sequencing of a species-specific chloroplast genomic region, as well as cytogenetic analyses in case of unexpected results for taxonomic verification. Out of the 112 B. oleracea and 154 B. rapa populations collected, 103 and 146, respectively, presented a good germination rate and eighteen populations were misidentified. The most frequent mistake was the confusion of these diploid species with B. napus. Additionally for B. rapa, two autotetraploid populations were observed. Habitats of the collected and confirmed wild populations and landraces are described in this study. The unique plant material described here will serve to investigate the genomic regions involved in adaptation to climate and microbiota within the framework of the H2020 Prima project ‘BrasExplor’.
Keywords
Wild populations, landraces, Brassica, genetic diversityIntroduction
Agriculture has to face great challenges to overcome global climate change and improve the sustainability of agricultural systems while maintaining crop production and quality. Regarding crop improvement, there are at least two main questions to consider: (i) which type of genetic diversity should we promote in breeding programmes to withstand the new climatic regime and (ii) which material to select for the development of new relevant varieties in this erratic context. Intensive farming systems and particularly modern breeding techniques have led to a drastic reduction in crop genetic diversity. On the other hand, local landraces and wild plant populations are a great source of genetic diversity. However, for many crop species such plant material has either never been collected, is not available, or has been poorly analyzed and/or characterized.
The two diploid species that we focused on in this study, Brassica oleracea L. (CC, 2n=2x=18) and B. rapa L. (AA, 2n=2x=20), are native to the Mediterranean basin (Bird et al., 2017; Cai et al., 2021; Cai, Bucher, Bakker, & Bonnema, 2022; Cheng et al., 2016; Mabry et al., 2021; McAlvay et al., 2021; Qi et al., 2017), in which they grow as wild populations or as local landraces selected over several generations by farmers. They encounter a large gradient of contrasted climate, soils and biotic factors from northern Europe to southern sub-Saharan regions, which makes these species particularly relevant for the analysis of diversity in relation to adaptation to the climate. The new populations will be complementary to accessions available in Biological Resource Centres (BRC) as they continue to evolve under current climatic constraints. Indeed, exploring these wild populations and local varieties represents a unique opportunity to identify locally adapted material for which genetic diversity and adaptive traits could be relevant to face upcoming climatic changes and disease emergences correlated to global change in the Mediterranean area, thus contributing to biodiversity-based agriculture.
Convergent evolution has led to similar morphotypes in these two economically important vegetable species that were locally selected for a long time by farmers all over the Mediterranean basin, mainly for their inflorescence at budding stage (cauliflower or broccoli for B. oleracea, broccoletto for B. rapa), leaves (cabbage, kale for B. oleracea; fodder turnip for B. rapa) or epicotyls/roots (kohlrabi for B. oleracea, turnip for B. rapa). This morphological convergence between the two species is linked to their recent common ancestor (Cheng et al., 2016) as they diverged only 2–4 million years ago (Cheng, Wu, & Wang, 2014). The morphological similarity between them is one of the reasons for some confusion when identifying the species. Additionally, a third species widely cultivated for seeds, resulting from the hybridization and genome doubling of the two diploid species, B. napus L. (AACC, 2n=4x=38), can also produce edible roots in swede cultivars, or leaves as forage or vegetable. As both species share many morphological characteristics with B. napus, species identification remains difficult at the seedling stage and controls are required before further analyses.
In this paper, we describe the collection, along a broad climatic gradient, of more than 100 populations each of B. oleracea and B. rapa species, including both landraces and wild populations, which co-evolve under current climatic constraints. To ensure the absence of species misidentification or potential interspecific hybrids at the seedling stage before sequencing, plants of each population were assessed using different methods sequentially from the easiest to the most time-consuming: (1) flow cytometry on all the plants based on different genome size and chromosome number (630Mb for 18 chromosomes in B. oleracea, 529Mb for 20 chromosomes in B. rapa) (Belser et al., 2018), (2) Sanger sequencing of a species-specific chloroplast genomic region on a sub-sample per population (Li et al., 2017), and (3) cytogenetic approaches in the event of unexpected results from the previous analyses. After these controls, the geographical distribution and ecological environment of each population were described. This unique plant material will support further analyses from our consortium investigating the genomic regions involved in local adaptation to climate and microbiota.
Materials and methods
Plant material
Wild populations of both B. oleracea and B. rapa species were collected in France based on information in the National Inventory of Natural Heritage database (INPN, 2024) and Maggioni, Bothmer, Poulsen, and Aloisi (2020). In addition, B. rapa wild populations were gathered in Italy, Algeria, Slovenia and B. oleracea in Spain (Gomez-Campo et al., 2005) based on local flora and long field experiences. Siliques were collected from 30 plants per population (when available), depending on the size and accessibility of populations. Some wild populations of B. oleracea closely related species were identified and added to the analysis: eight B. montana Pourr. populations (six from France and two from Italy), as well as two B. rupestris Raf. (subsp. rupestris), two B. villosa Biv. [subsp. drepanensis (Caruel) Raimondo & Mazzola and subsp. tineoi (Lojac.) Raimondo & Mazzola], one B. macrocarpa Guss., and one B. incana Ten., all from Sicily, Italy. B. oleracea and B. rapa landraces were collected in five different countries either through direct collects on farms in Algeria, Tunisia and Italy or in BRC maintaining old landraces in France (BRC BrACySol) and Slovenia (Slovene Plant Gene Bank in Slovenia, SRGB KIS). In agreement with each country’s policy, the Nagoya Protocol will be applied, pending the introduction of the relevant collected material into the Multilateral System of the FAO’s International Treaty on Plant Genetic Resources for Food and Agriculture. Thus, during this transition period, the material will be available after seed production upon request, either in BRC BrACySol and SRGB for French and Slovenian populations, respectively, or by contacting the partner in each country, as reported in Supplemental Tables 1 and 2.
Each collected population was named following a specific code. It starts with (1) two letters representing the species (BO for B. oleracea, BR for B. rapa, BM for B. montana, BU for B. rupestris, BV for B. villosa, BA for B. macrocarpa, and BI for B. incana), followed (2) by a letter for the country of origin (F for France, I for Italy, S for Slovenia, E for Spain, A for Algeria, or T for Tunisia), (3) then four letters indicating the location of the collecting site, (4) either a W for a wild population or an L for a landrace, (5) and an additional letter (A, B, C, etc.) in case of several collecting sites at the same location (i.e. BR_I_CAST_W_A and BR_I_CAST_W_B). For all these populations, a common sheet was filled for wild populations to describe the environment (Supplemental Table 1) and another one for landrace collects at the farm or when seeds were acquired from Genetic Resource Centres (GRC BrACySol in France, KIS in Slovenia) (Supplemental Table 2).
Thirty plants per population were grown in the greenhouse for taxonomy assessments. For wild populations, we planted one seed of each of the 30 collected mother plants. When seeds were collected from fewer than 30 plants, we sowed several seeds per mother plant, equally represented, to reach a total of 30 seeds. For landraces, 30 seeds were sown.
As controls for the different experiments, we used a known representative of B. oleracea, B. rapa and B. napus species: doubled haploid lines of B. oleracea subsp. italica (HDEM) and B. rapa subsp. trilocularis (Z1) (Belser et al., 2018) and a pure line of B. napus subsp. oleifera, ‘Darmor’.
Cytogenetic control and chromosome counts
Flow cytometry was performed on all plants to assess the chromosome number of each plant using leaves as described by Leflon et al. (2006). Briefly, approximately 0.5cm2 of fresh leaves were harvested and transferred to a Petri dish. This material was chopped using a sharp razor blade in 300µl of nuclei extraction staining buffer (from kit CystainTM UV Presice P-Sysmex) and incubated at room temperature for 30 to 90sec. 1.2ml of DAPI staining buffer was added per sample and the solution was then filtered through a 50µm nylon mesh. Estimation for each accession was obtained with FlowMax software using a CyFlow space cytometer (Sysmex Inc.). For the screening of B. oleracea and independently of B. rapa populations, the control variety, HDEM for B. oleracea and Z1 for B. rapa, was adjusted to a fluorescence intensity value of 300 for nuclei at G1 stage. Coincidence or deviation was compared with these controls.
For populations for which flow cytometer and chloroplast sequencing data were not congruent, the chromosome number was also determined from mitotic chromosomes observed on metaphasic cells isolated from root tips. Root tips of 0.5–1.5cm in length were treated in the dark with 0.04% 8-hydroxiquinoline for 2h at 4°C followed by 2h at room temperature to accumulate metaphases. They were then fixed in 3:1 ethanol:glacial acetic acid for 48h at 4°C and stored in 70% ethanol at -20°C until use. After being washed in distilled water for 10min, in HCl 0.25 N for 10min, then treated for 15min with a 0.01M citric acid-sodium citrate buffer (pH 4.5), root tips were incubated at 37°C for 30min in an enzymatic mixture (5% Onozuka R-10 cellulase (Sigma), 1% Y23 pectolyase (Sigma)). The enzymatic solution was removed and the digested root tips were then carefully washed with distilled water for 30min. One root tip was transferred to a slide and macerated with a drop of 3:1 fixation solution. Dried slides were then stained by a drop of 4’,6-diamidino-2-phenylindole (DAPI). Cells were viewed with an ORCA-Flash4 (Hamamatsu, Japan) on Axio Imager Z.2 (Zeiss, Oberkochen, Germany) and analyzed using Zen software (Carl Zeiss, Germany).
Fluorescence in situ hybridization (FISH)
The BoB014O06 BAC clone from B. oleracea BAC library (Howell, Kearsey, Jones, King, & Armstrong, 2008) was used as probe for ‘genomic in situ hybridization (GISH)-like’ to distinguish specifically all C-genome chromosomes in B. napus (Suay et al., 2014). The BoB014O06 clone was labelled by random priming with Alexa-594 dUTP (red) (Thermo Fisher Scientific). The ribosomal probe 45S rDNA used in this study was pTa71 (Gerlach & Bedbrook, 1979) which contained a 9-kb EcoRI fragment of rDNA repeat unit (18S-5.8S-26S genes and spacers) isolated from Triticum aestivum L. pTa71 was labelled by random priming with biotin-14-dUTP (Invitrogen, Life Technologies). Biotinylated probes were immunodetected by Fluorescein avidin DN (green) (Vector Laboratories). The chromosomes were mounted and counterstained in Vectashield (Vector Laboratories) containing 2.5µg/mL 4’,6-diamidino-2-phenylindole (DAPI) (grey). Fluorescence images were captured using an ORCA-Flash4 (Hamamatsu, Japon) on an Axio Imager Z.2 (Zeiss, Oberkochen, Germany) and analyzed using Zen software (Carl Zeiss, Germany).
Species identification by sequencing of a chloroplast region
The aim was to amplify a chloroplast genomic region containing diagnostic single nucleotide polymorphisms (SNPs) or indels for B. oleracea, B. rapa or B. napus. To that purpose, we first retrieved and aligned the Brassica chloroplast genome sequences available for the three species fromLi et al. (2017) using Geneious Prime 2022.2.2 (https://www.geneious.com ). We then identified a genomic region and designed consensus primers enabling us to discriminate each species. The consensus primers allowed amplification of 1,118pb for B. oleracea, 1,088pb for B. rapa or 1,084pb for B. napus. DNA of one to three plants per population and of control lines was extracted using 50mg of fresh leaf tissue, which had previously been freeze-dried, and the Nucleospin Plant II kit (Macherey Nagel). The consensus primers used were trnK-rps16_F (5’ CATAAACAGGTAGACTGCTAACTGG 3’) and trnK-rps16_R (5’ GTATTCTTCCTAAAGGTATGAAAACTAAC 3’) with following PCR reagents: 1X buffer, MgCl2 2mM, dNTPs 0.25mM, Primers 0.5µM each, Taq Promega 1.5U and 5ng DNA of the sample analyzed. The PCR conditions were a denaturation 94°C 2min, then 35 cycles 94°C 30sec - 59°C 30sec - 72°C 1min 30sec, with a final elongation 72°C 10min. The amplified region was then sequenced by Sanger (Genoscreen) and analyzed using Geneious software (https://www.geneious.com ). All amplified chloroplast sequence data have been deposited into NCBI/GenBank as PopSet 2716368500.: PP619885 - PP620127).
Results
Taxonomic verification of the collected populations
Among the collected populations (Table 1), the first limiting factor encountered was the germination of the collected seeds, even under favourable controlled conditions applied on automated germination tools for B. rapa, in spite of seed viability confirmed by tetrazolium staining. Specifically, 6.8% of the collected populations showed a poor emergence in the greenhouse with less than 30 plants per population and were not considered for further analyses. This low germination rate may be attributed to two different factors: the high level of seed dormancy (observed here in 18.2% of B. rapa wild populations) and the seed conservation of landraces collected on farms (5.2% and 14.9% of seeds showed very poor germination for B. rapa and B. oleracea landraces, respectively).
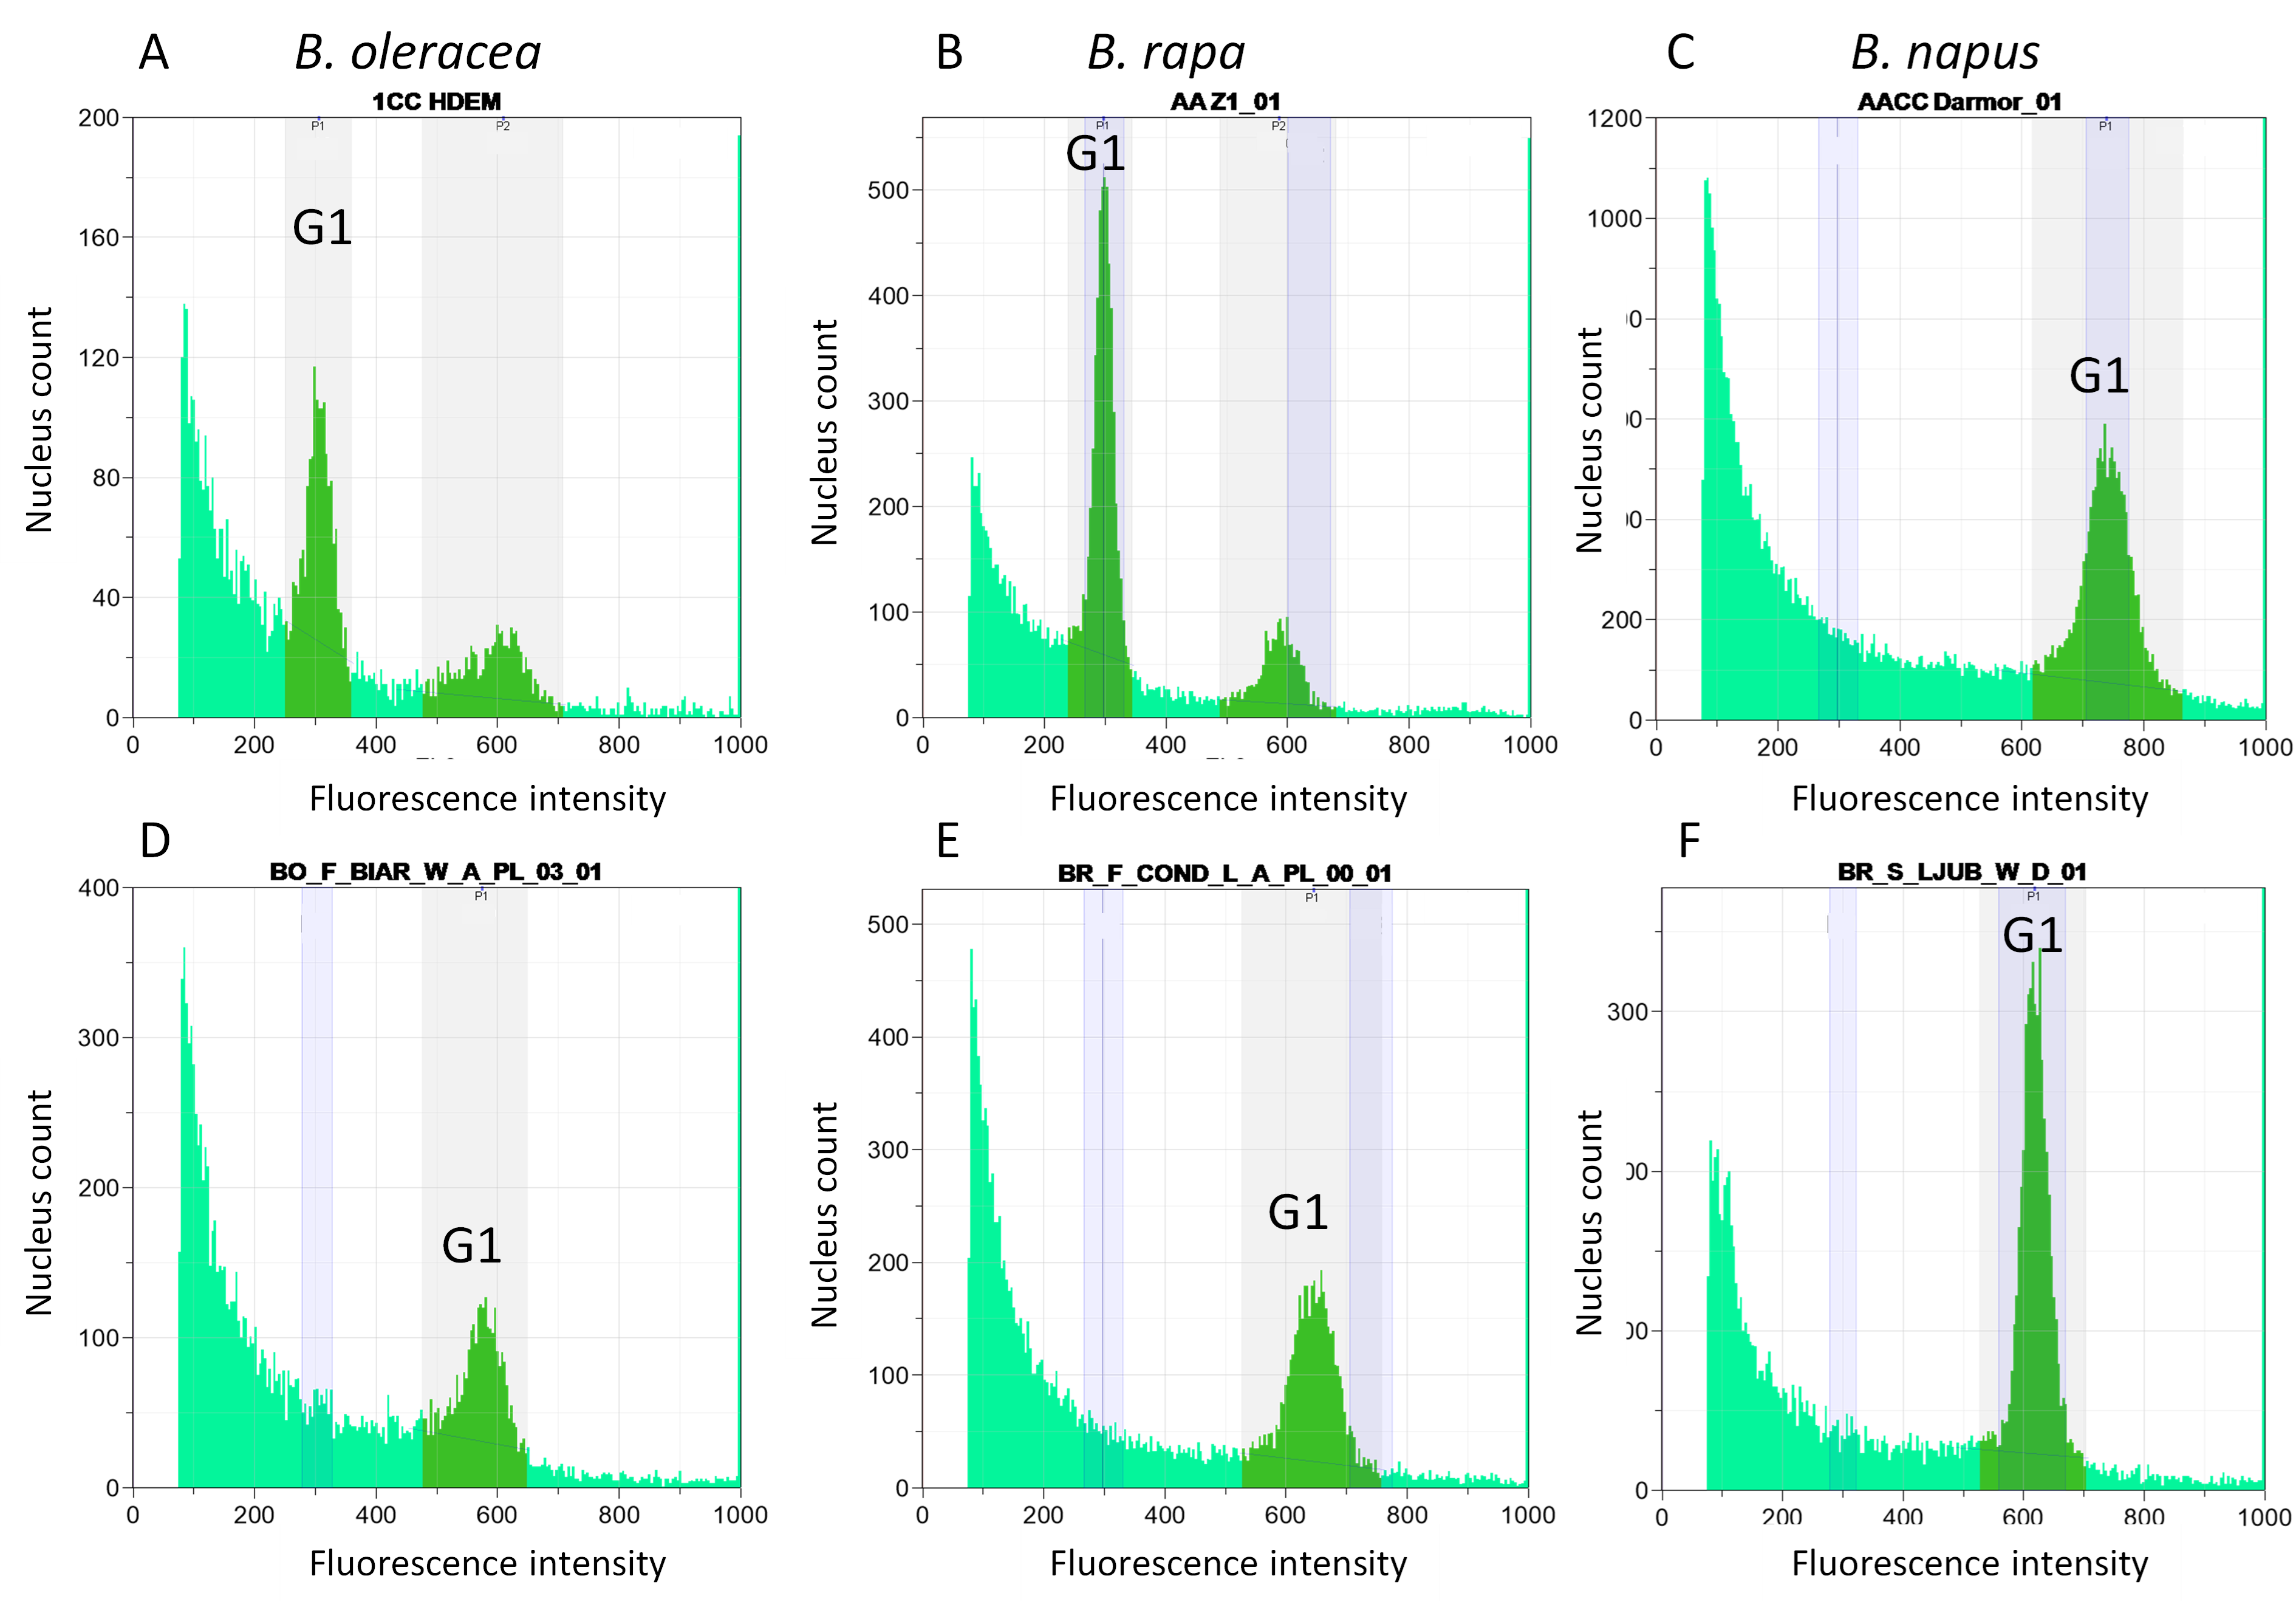
To validate the correct species identification of each collected population and to verify the absence of contamination in the collected seeds, we performed flow cytometry on all the plants grown representing a population. As the investigated species have different profiles linked to their differences in DNA content (630Mb for 18 chromosomes in B. oleracea, 529Mb for 20 chromosomes in B. rapa) (Figure 1A), it was possible to determine with +/-2 chromosomes the genomic structure of each plant.
|
Expected species |
Expected subspecies |
Collected populations |
Populations with a satisfying germination |
Validated populations/ species-subspecies |
|
Wild populations |
||||
|
Brassica oleracea |
oleracea |
45 |
45 |
44 |
|
Brassica incana |
|
1 |
1 |
1 |
|
Brassica macrocarpa |
|
1 |
1 |
1 |
|
Brassica montana |
|
8 |
8 |
8 |
|
Brassica rupestris |
rupestris |
2 |
2 |
2 |
|
Brassica villosa |
drepanensis |
1 |
1 |
1 |
|
Brassica villosa |
tineoi |
1 |
1 |
1 |
|
Brassica rapa |
sylvestris/campestris |
77 |
73 |
63 |
|
Landraces |
||||
|
Brassica oleracea |
acephala |
9 |
9 |
9 |
|
Brassica oleracea |
botrytis |
6 |
6 |
6 |
|
Brassica oleracea |
capitata |
19 |
19 |
19 |
|
Brassica oleracea |
gemmifera |
1 |
1 |
1 |
|
Brassica oleracea |
gongylodes |
1 |
1 |
1 |
|
Brassica oleracea |
italica |
6 |
5 |
5 |
|
Brassica oleracea |
medullosa |
6 |
6 |
6 |
|
Brassica oleracea |
ramosa |
2 |
2 |
2 |
|
Brassica oleracea |
sabauda |
1 |
1 |
1 |
|
Brassica oleracea |
unknown |
16 |
8 |
6 |
|
Brassica rapa |
rapa |
71 |
68 |
63 |
|
Brassica rapa |
sylvestris var. esculenta |
6 |
5 |
5 |
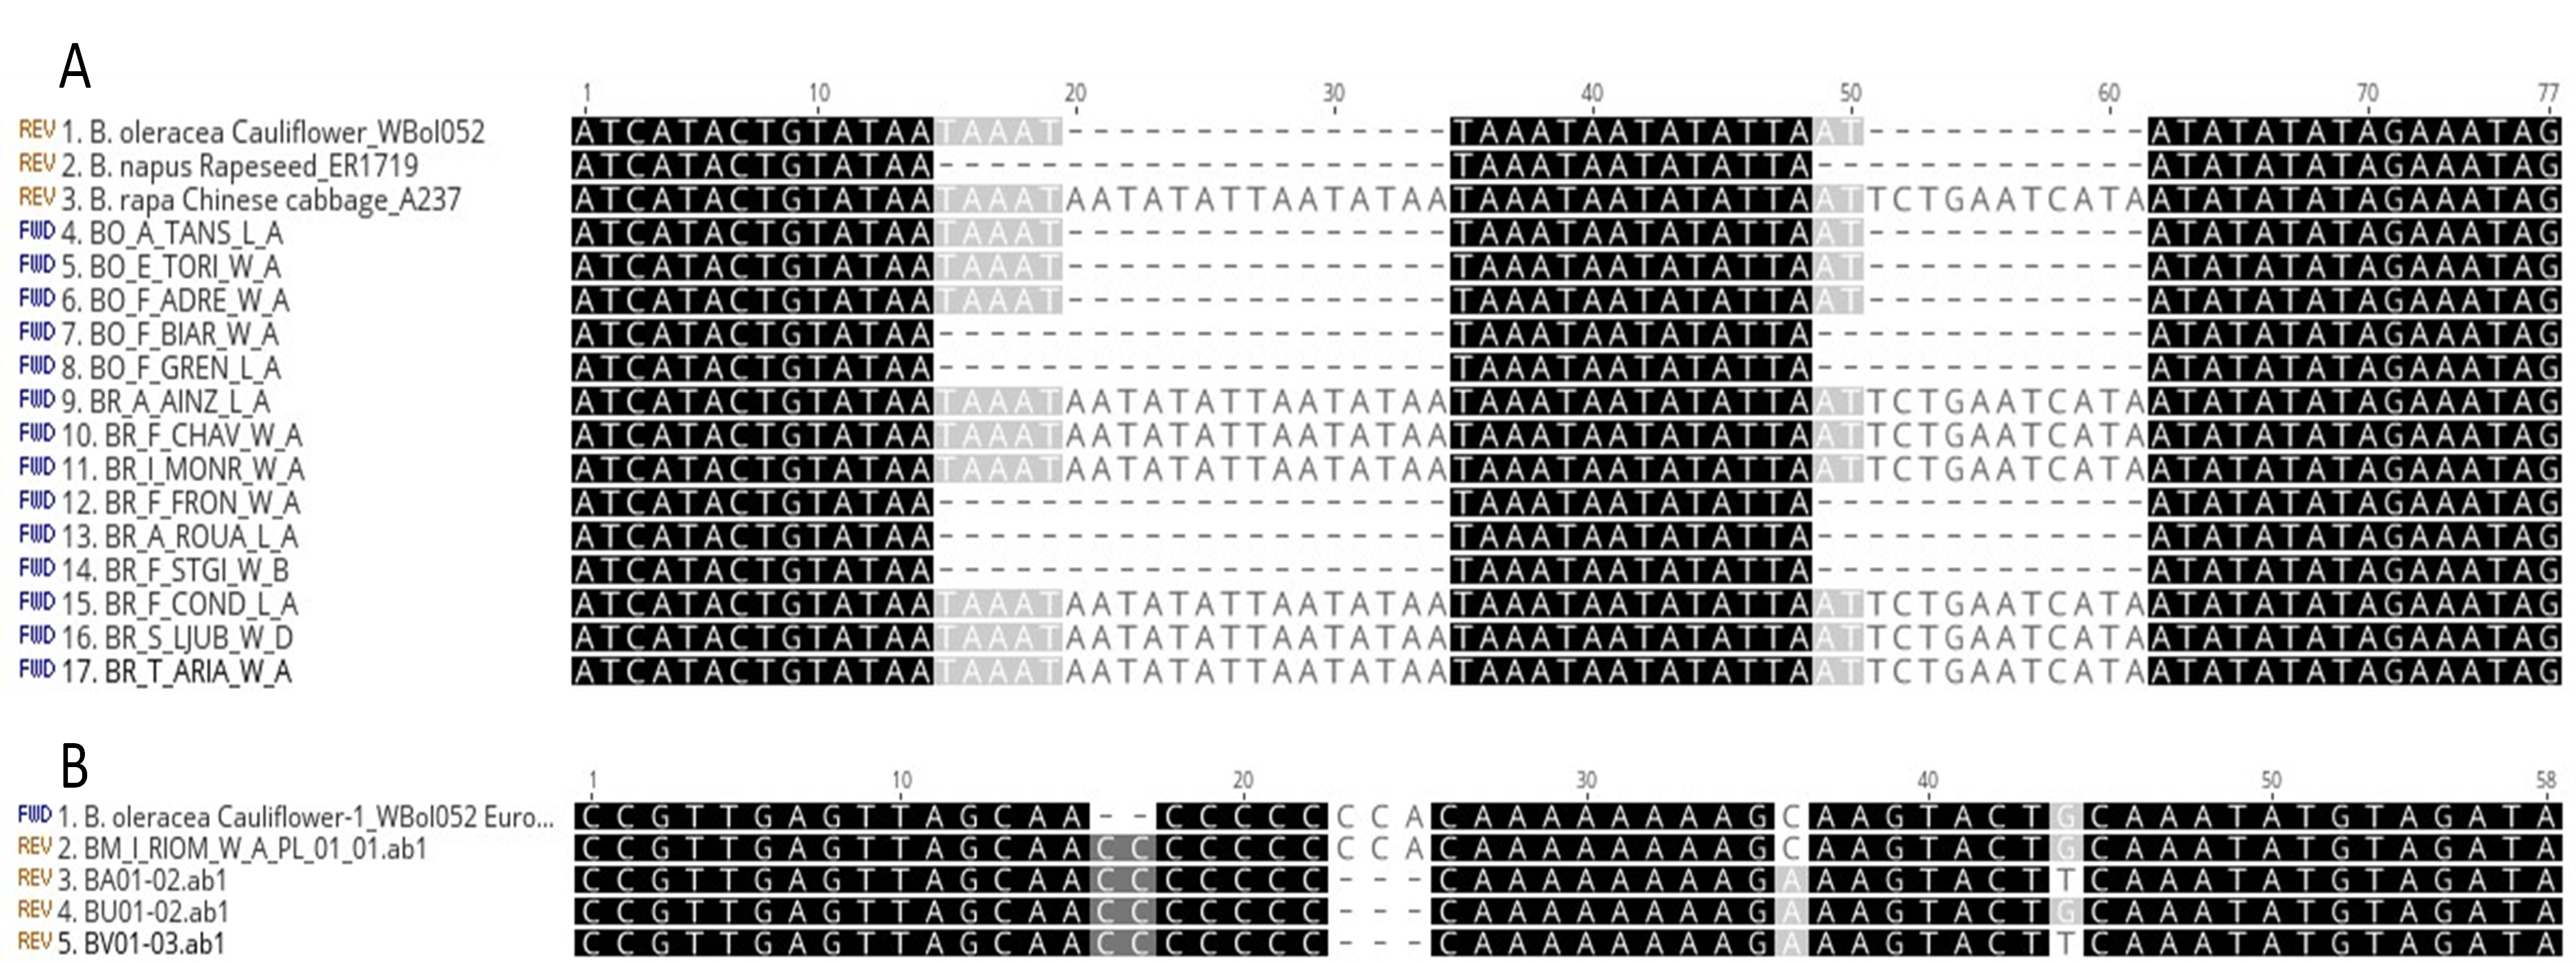
Due to possible contamination with species having a close chromosome number, this analysis was complemented by sequencing a chloroplast genomic region that showed species-specific differences. We chose a genomic region with a sequence specific to each species according to (Li et al., 2017). The size of the amplified regions was 1,118bp, 1,088bp and 1,084bp for B. oleracea, B. rapa and B. napus, respectively (all these chloroplast sequences are available on NCBI/GenBank as PopSet 2716368500.: PP619885 - PP620127). After aligning the sequences, we compared the sequences obtained in the sampled populations with those of the controls for the three species. We observed four SNPs and six Indels specific to B. oleracea, four SNPs and four Indels specific to B. rapa and three SNPs and five Indels specific to B. napus (examples provided in Figure 2A). B. montana (2n=18) differed from B. oleracea at only three SNPs and one Indel whereas B. villosa and B. macrocarpa differed from B. oleracea at 17 SNPs and six Indels. B. rupestris showed exactly the same sequence as the two latter species except for one SNP, indicating that these three species (B. villosa, B. macrocarpa and B. rupestris) are highly related to each other whereas B. montana seems closer to B. oleracea (Figure 2B).
When flow cytometer and sequencing data were not congruent, chromosome counting was performed during mitosis to identify the species. This observation was combined with GISH-like allowing identification of the C chromosomes and of rDNA locus number, specific to each species with four, ten and 12 rDNA loci for B. oleracea, B. rapa and B. napus, respectively (Figure 3).
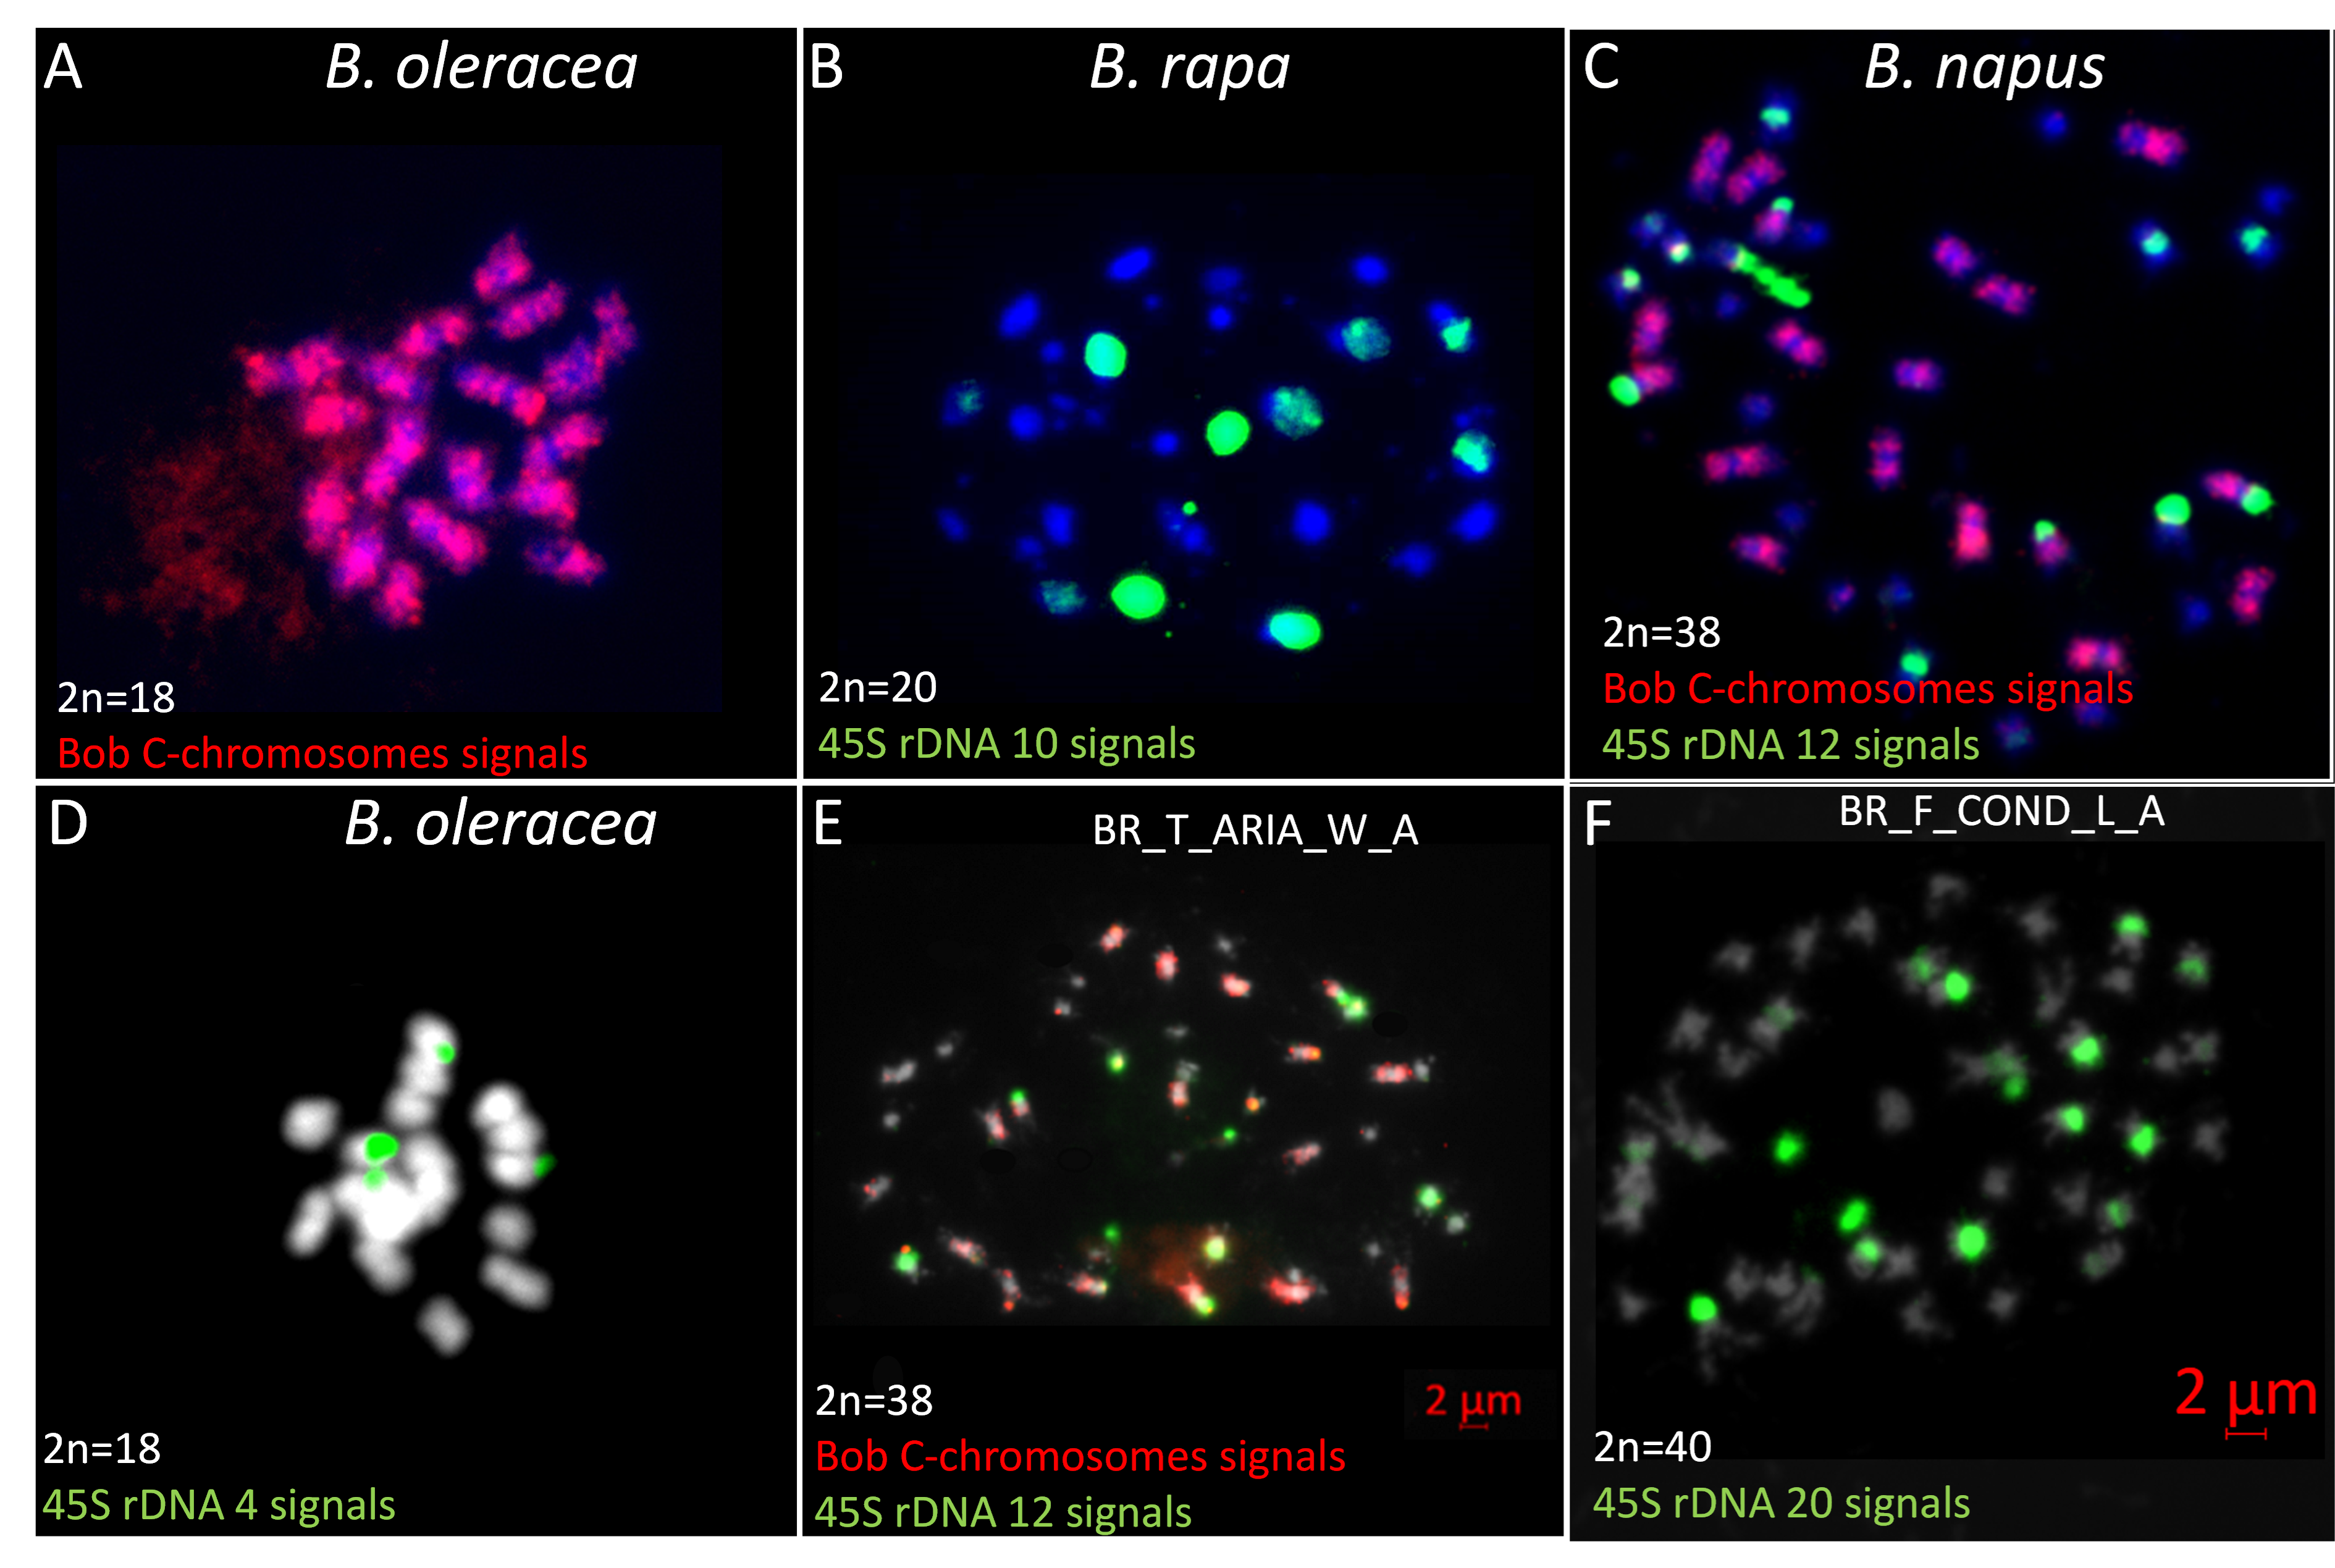
By FISH, in B. rapa (A genome) (Figure 3B), the 45S rDNA probe (green) marks five different chromosomes. The strongest FISH signal located on the A03 chromosomes reflects a large number of genes. The second gene-rich locus is located on A01 chromosome proximal to the centromere. The remaining sites are located on cytogenetically undistinguishable A05, A06 and A09 chromosomes. B. oleracea (C genome)(Figure 3D) had two pairs of chromosomes (C07, C08) containing 45S rDNA loci. The sites localized on chromosome C08 show extensive decondensation while loci on C07 are fully condensed. In natural B. napus, we observed twelve 45S rDNA signals and the BOB014O06 staining revealed that eight signals were located on A genome and four on the C genome (Książczyk et al., 2011) (Figure 3C).
All the misidentified populations were listed in Supplemental Table 3. The most frequent mistake was confusing B. oleracea or B. rapa with B. napus. Among the 103 B. oleracea populations analyzed, only three were misidentified (one wild and two landraces) and were thereafter confirmed to belong to B. napus using flow cytometry (Figure 1D). This misidentification was also validated by chloroplast sequencing (Figure 2A) and chromosome counting. Among the 146 analyzed B. rapa populations, 15 were misidentified, out of which 12 were identified as B. napus. Nine of these 12 populations were sampled in the wild and are probably volunteers of B. napus, i.e. escaped from the fields. All these data were confirmed by the sequencing of a chloroplast genomic region (Figure 2A) revealing that all carried B. napus chloroplasts except for one wild Tunisian population (BR_T_ARIA_W_A), which had a B. rapa type chloroplast. The B. napus origin of this population was confirmed by cytogenetic analyses, revealing the presence of nine C chromosomes and 12 45S rDNA signals by FISH, eight on A genome and four on C genome (Figure 3E). Among the three remaining misidentified B. rapa populations, one wild population from Tunisia had a cytometry value close to B. rapa but no chloroplast gene amplification was detected; further morphological observations of this population revealed that it probably belongs to the genus Sinapis. The two last cases observed were B. rapa populations (one Slovenian wild population BR_S_LJUB_W_D and one French landrace BR_F_COND_L_A) having a flow cytometry value close to the one of B. napus (Figure 1E and Figure 1F) but a B. rapa chloroplast genomic sequence. Using cytogenetics, we detected no C chromosomes after a GISH-like experiment and 20 45S rDNA were counted, i.e. five rDNA loci per A genome (Figure 3F), which led us to the conclusion that these populations were in fact B. rapa autotetraploids (AAAA, 2n=4x=40).
Most of the populations confirmed as belonging to a specific species had an identical chloroplast sequence. Nevertheless, we observed a few SNPs specific to some populations. In B. oleracea, two SNPs were specific to only seven populations (BO_F_JOUY_L_A, BO_S_LJUB_L_G, BO_S_LJUB_L_H, BO_S_LJUB_L_L, BO_S_LJUB_L_M, BO_S_LJUB_L_N and BO_S_LJUB_L_O) and one allele at a different SNP was specific to BO_F_MERS_W_A. In B. rapa, three variations differentiated a few populations, one SNP in BR_A_DELL_W_A, one base deletion in BR_A_SEBA_W_A and BR_A_BOME_W_A and one SNP in BR_A_BLID_W_A, BR_A_BOUF_W_A, BR_A_CHLE_W_A, BR_A_BARA_W_A. These differences were observed in all the individuals tested per population.
For B. oleracea related species (B. montana, B. rupestris, B. villosa, B. macrocarpa and B. incana), all collected populations per species had the same flow cytometry value and the same chloroplast sequence.
Description of the populations
After discarding the few populations that did not germinate or were misidentified (Supplemental Table 3), we further characterized the remaining populations and their respective data collected during harvest.
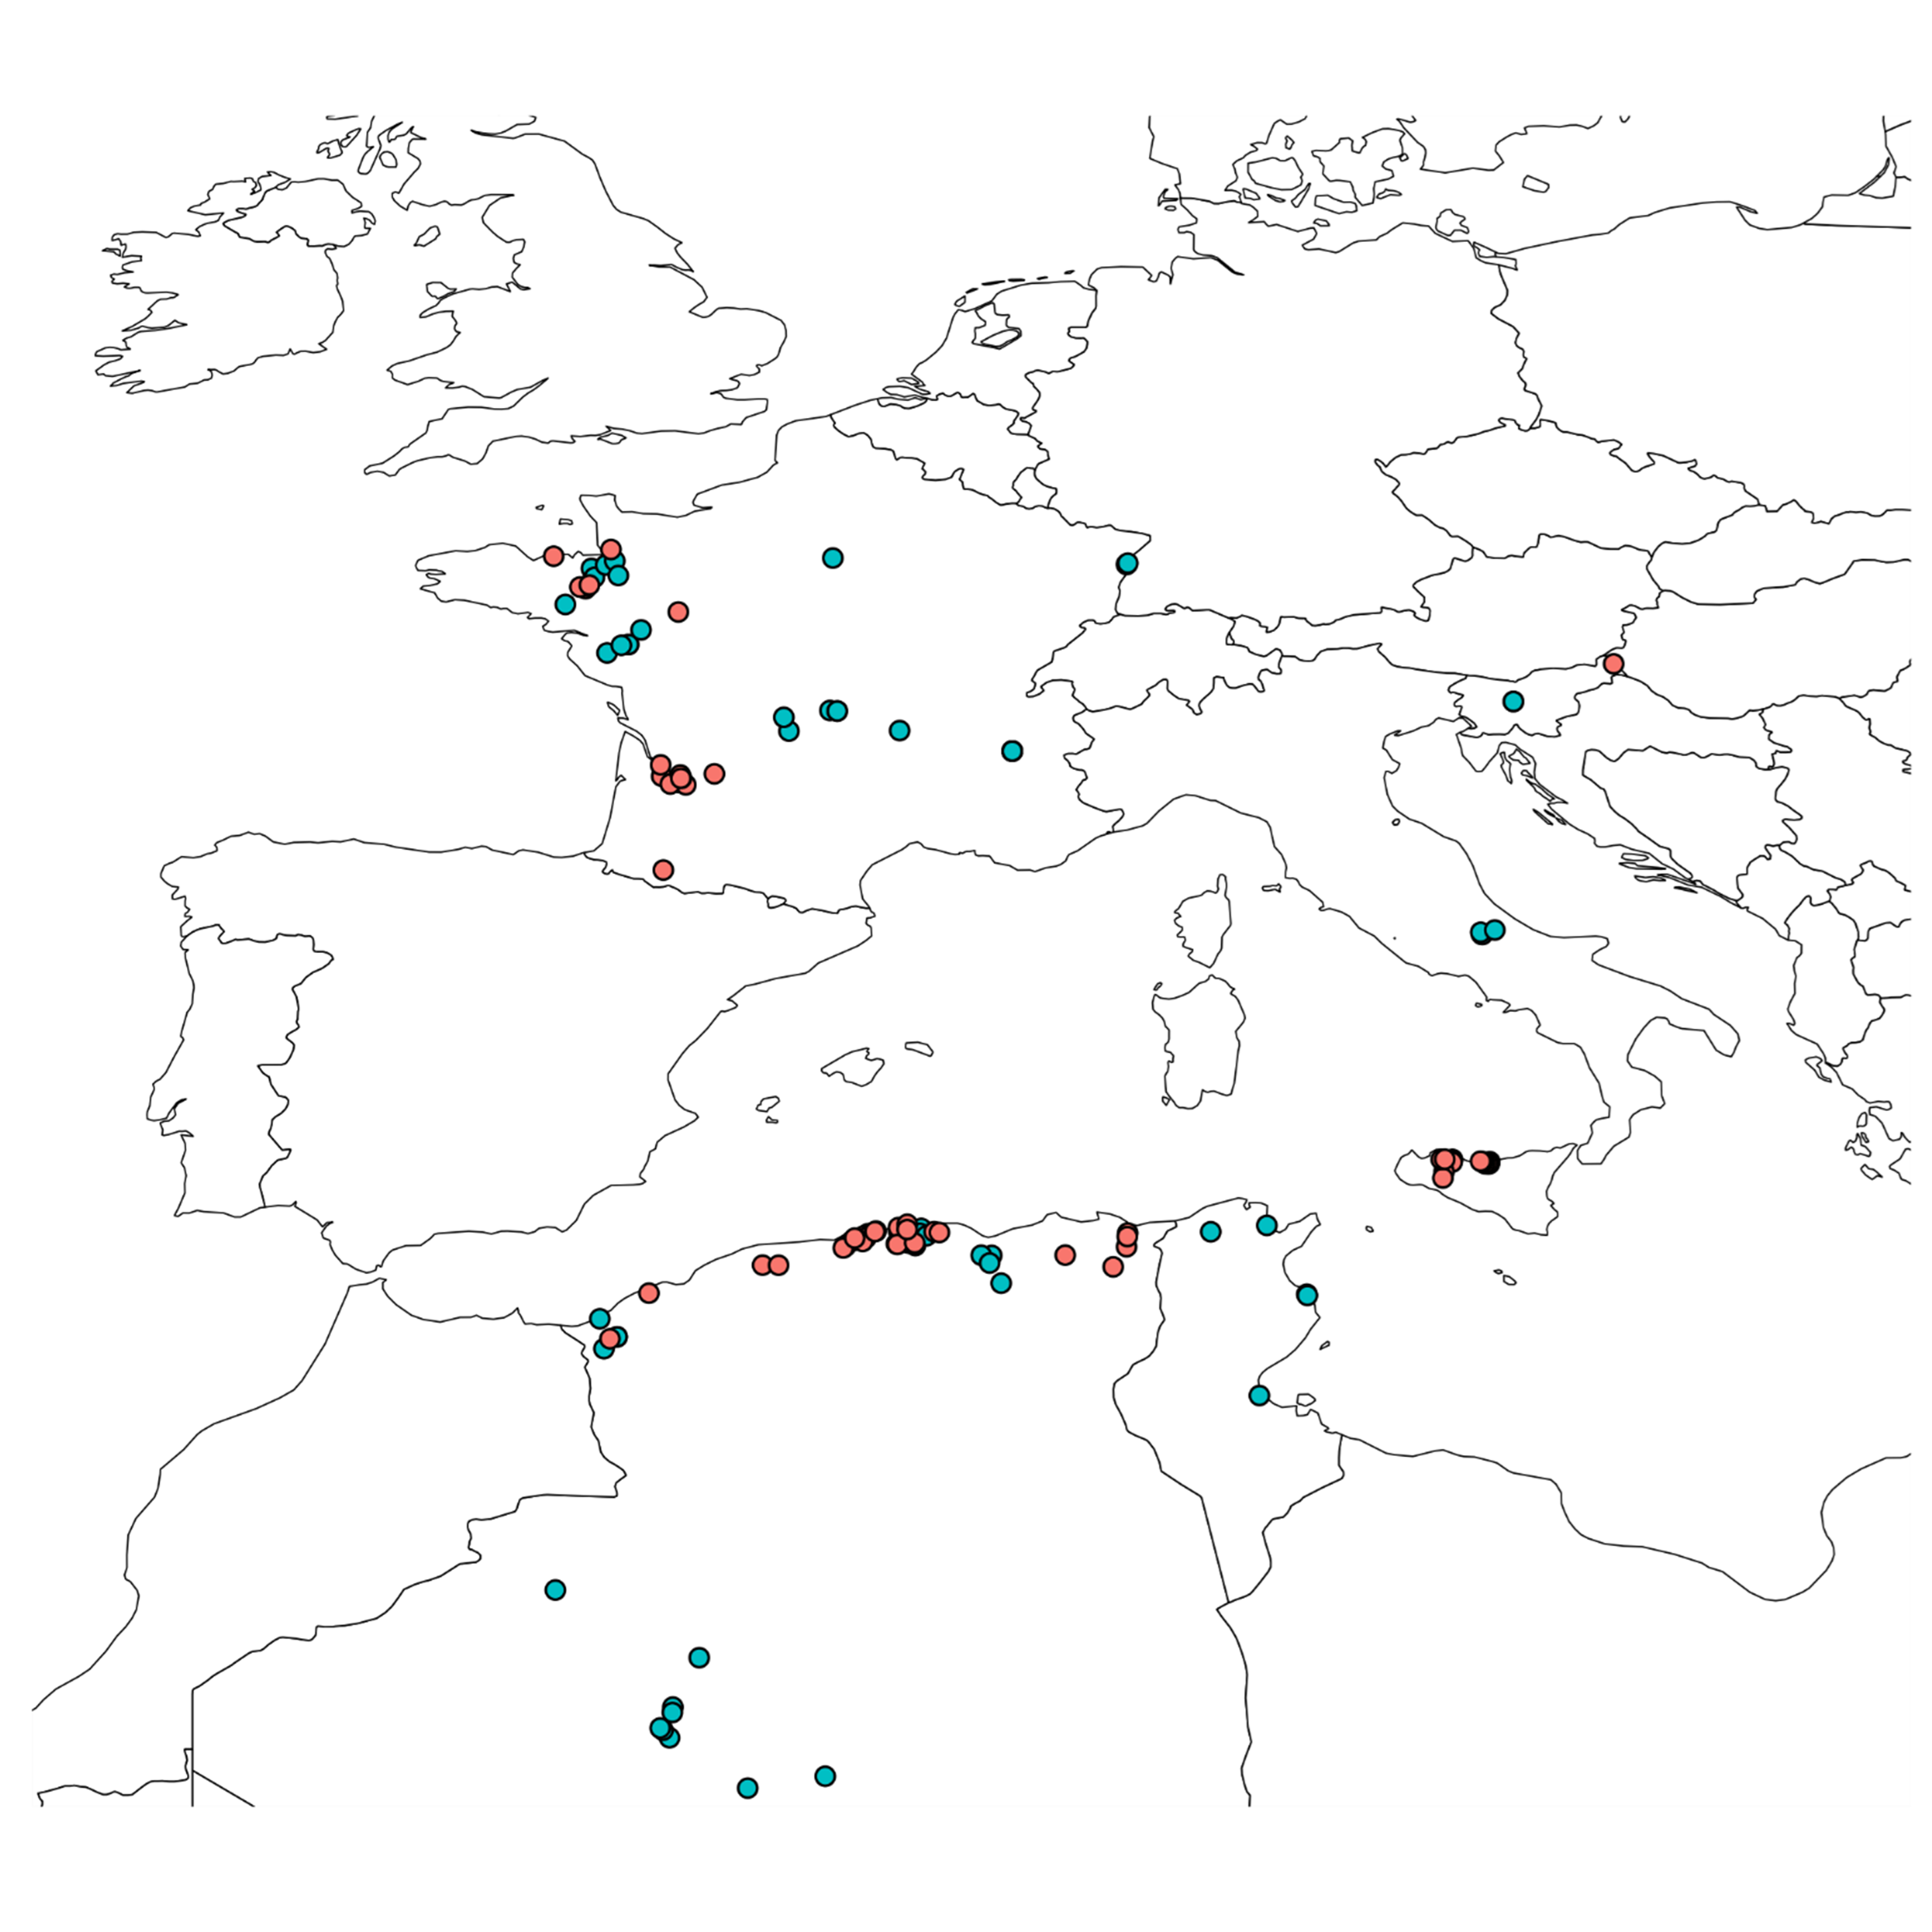
Wild B. oleracea populations were collected on cliffs on the Atlantic coast in France and Spain (Figure 4), whereas its related species (B. montana, B. rupestris, B. villosa, B. macrocarpa and B. incana) were growing more in southern regions, on the Mediterranean coast. Their locations and the characteristics of each environment are described in Supplemental Table 1.
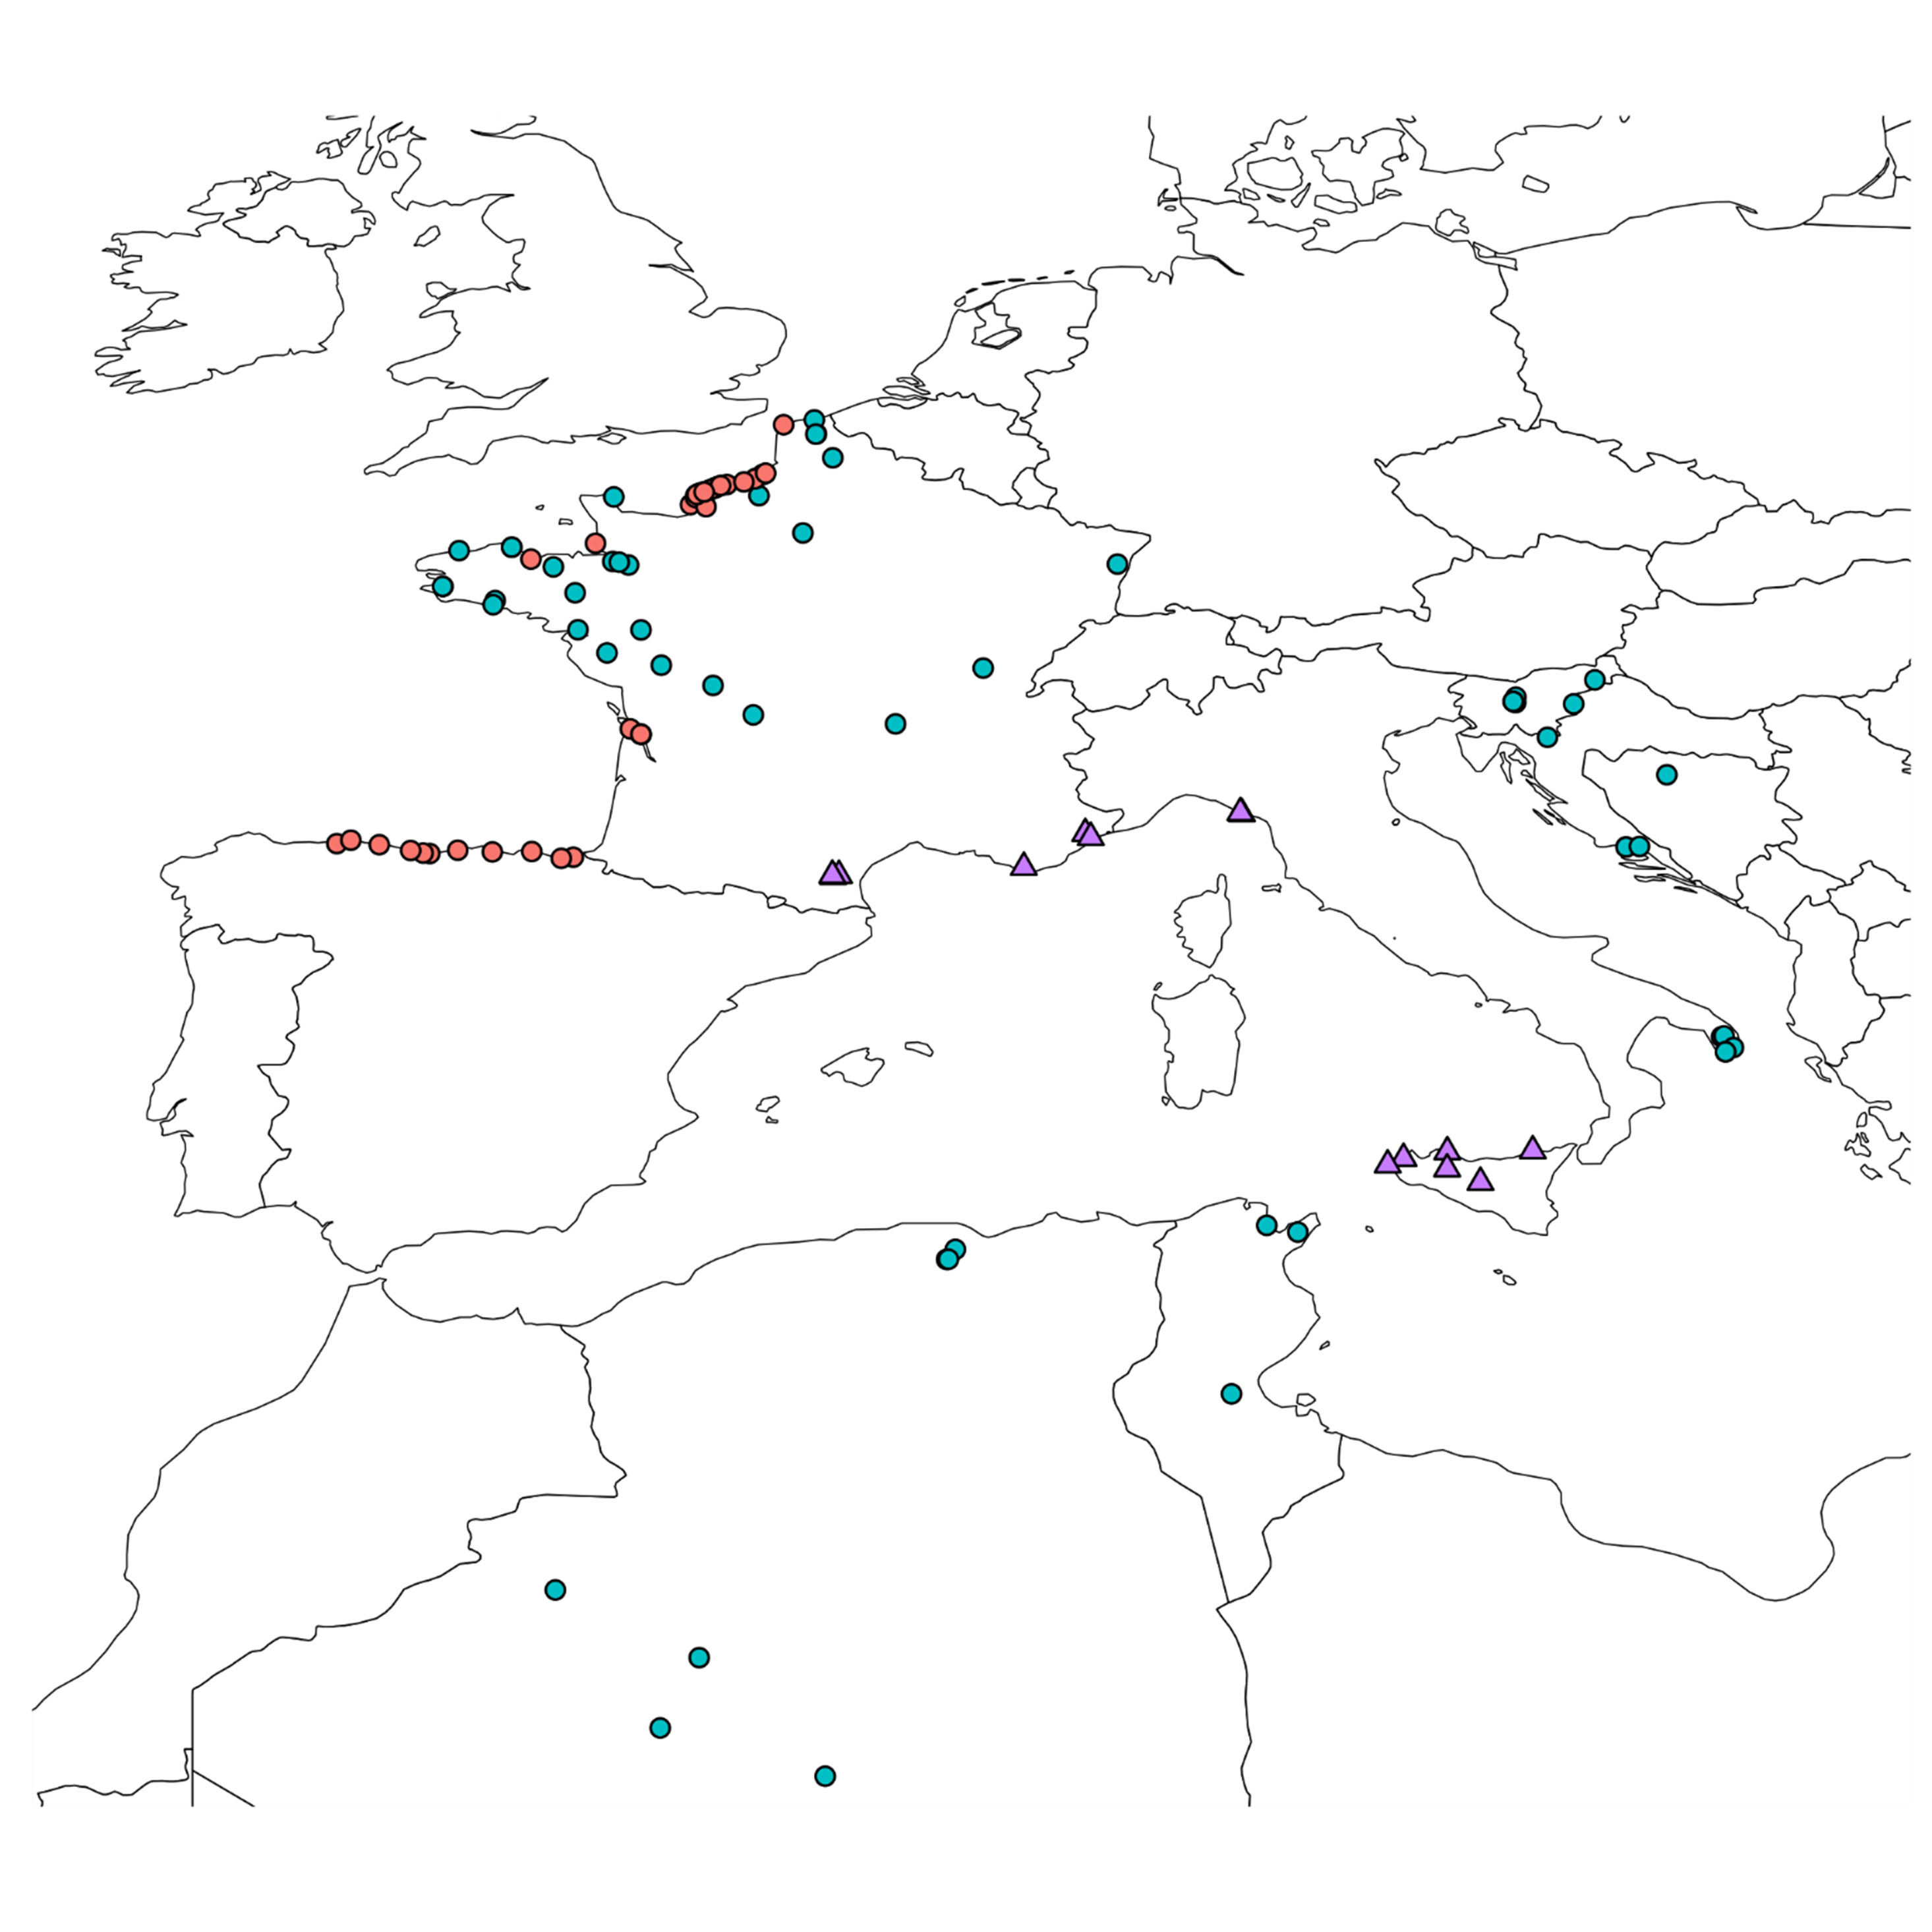
B. oleracea landraces were selected by farmers in each country, even in very warm regions such as the south of Algeria (Figure 4; Supplemental Table 2). Selection of different organs for crop production (flowers, leaves, stems or roots) has led to the divergence of highly diverse phenotypes. It is worth mentioning that some morphotypes were difficult to classify in one subspecies as some of them were domesticated at the same time for leaf production (such as subsp. acephala) and for head cabbage (such as subsp. capitata, e.g. BO_A_TAZL_L_A). Additionally, even within the same morphotype, different developmental traits can be observed such as in Mugnuli populations (south of Italy) with several floral heads compared to common broccoli (Laghetti et al., 2005).
Wild B. rapa populations (Figure 5; Supplemental Table 1) were found in locations where competition with other species is lower, such as vineyards, orchards or field margins. Thus, regardless of the country, the populations were generally large.
The majority of the collected B. rapa local landraces (Figure 5; Supplemental Table 2) were turnips (subsp. rapa) with the exception of few broccoletto (subsp. sylvestris var. esculenta) selected by Italian farmers.
Discussion
In this paper, we described the sampling of wild populations and local landraces of B. oleracea and B. rapa along a large climatic and soil gradient from the north of France to the Sub-Saharan regions. Our objective was to validate at the early stage of plant development before sequencing that the seeds collected from plants of 112 and 154 of B. oleracea and B. rapa populations (both wild and local landraces), respectively, belonged to the expected botanical species. Then the origin of each population is described as a preliminary material for future botanical determination and plant adaptation genetic studies.
The first limiting factor was germination. Seed dormancy was only detected among B. rapa populations. In spite of seed viability confirmed by tetrazolium staining and of cold treatment, we did not succeed in getting enough seedlings per mother for four B. rapa wild populations to keep the initial genetic diversity of the populations. This trait, described in Brassica as primary physiological dormancy (Finch-Savage & Leubner-Metzger, 2006), seems to be a characteristic of some wild B. rapa populations. In our case, some populations met problems of imbibition as the seed coat was impermeable. Puncturing the seed coat before adding gibberellic acid improved germination for Sicilian and some Algerian wild populations. These results indicated a seed coat imposed dormancy in B. rapa which has not been described for Brassica (Baskin & Baskin, 1998). The conditions of seed conservation on the other hand is a likely explanation for the low germination rate in landraces of both species. This observation highlights the importance of seed quality and storage conditions, especially in BRCs (Subramanian, Kim, & Hahn, 2023).
Because of the morphological similarity between the species at the seedling stage, our controls have revealed the importance of performing molecular and cytogenetic analyses before undertaking genetic sequencing and agronomic studies. We decided to combine a straightforward method, flow cytometry for assessment of chromosome number with a more expensive one, sequencing of a species-specific chloroplast region to validate the taxonomy. We applied more difficult and time-consuming cytogenetic methods for populations showing incongruent results with the two first methods. Flow cytometry is a high throughput technique allowing DNA content assessment of all plants, here 30 plants per population. Yet, as several species of the Brassiceae tribe have a similar DNA content, this technique might not be precise enough (Leflon et al., 2006) to validate the species. That is the reason why we complemented this analysis by sequencing a species-specific chloroplast genomic region taking advantage of the whole chloroplast genome sequences of many Brassica species/populations published by Li et al. (2017). The combination with the analysis of chloroplast sequences allowed the confirmation of a misidentification for one Tunisian population presenting a flow cytometry value similar to B. rapa but no chloroplast amplification as it probably belongs to the genus Sinapis. However, the most frequent mistake was a confusion with B. napus, showing a higher DNA content, detectable by flow cytometry. Yet, among the 17 populations identified as B. napus by flow cytometry (three populations in the B. oleracea and 14 in the B. rapa collections), three had a chloroplast sequence similar to B. rapa. This conflicting result called for further cytogenetic experiments for these three populations, using GISH-like on mitotic chromosomes with a BAC specific to B. oleracea chromosomes (Suay et al., 2014) and 45S rDNA probes revealing the number of rDNA loci (Książczyk et al., 2011). From this data, we concluded that one Tunisian population was indeed a B. napus population. It could be interesting to precisely compare after chloroplast assembly with the results reported by Li et al. (2017). These authors reported that B. napus chloroplasts can be classified into two different clades identified from different B. rapa morphotypes. The two other populations were B. rapa autotetraploids, with 40 A chromosomes and 20 45S rDNA loci as expected when doubling the A genome. Such autopolyploid populations were previously reported for the production of new forage varieties (Olsson & Ellerström, 1980).
Among the 100 and 131 confirmed diploid populations for B. oleracea and B. rapa respectively, chloroplast sequences revealed only a few variants SNV (Li et al., 2017) for some accessions in both species. The low mutation rate of the chloroplast DNA in most flowering plant families can explain these variations as already reported from global chloroplast assembly. Interestingly,Li et al. (2017) observed more SNVs in the B. rapa than in the B. oleracea genotypes that they investigated, with 343 and 16 SNV, respectively. By investigating an enlarged B. oleracea diversity,Perumal et al. (2021) described more SNVs with clustering of different cultigroups. In our collected wild and landrace populations, we observed that a common variation is shared by seven populations belonging to capitata and acephala groups originating from Slovenia with the exception of one French landrace. For B. rapa, SNV were only observed in some wild Algerian populations. Further studies are in progress in order to compare the genetic diversity from chloroplast assembly and nuclear SNP, taking into account the different cultigroups and their geographic origins.
A large morphological diversity was observed among the B. oleracea landraces whereas wild populations were morphologically similar to forage kales. For Mugnoli belonging to the same group as broccoli (subsp. italica), Biancolillo et al. (2023) developed a non-destructive tool based on Multivariate Image analysis and agro-morphological descriptors for the characterization and authentication of these local varieties. For B. rapa, landraces selected by farmers are mainly turnips, with the exception of five populations of Broccoletto. In this paper, we describe the different environments in which these different populations were collected.
This well-characterized material collected on a very large climatic and soil gradient opens the prospect of identifying genomic regions involved in adaptation to climatic constraints and microbiota descriptors (fungus and bacterial composition). To do so, seeds were produced at the same geographic location in order to avoid the environmental effects of the collecting site on seed quality. High-throughput sequencing for bulks of 30 plants per population is currently ongoing to capture the maximum diversity existing within the population. Mapping the reference genome of each species and SNP calling will allow the description of genetic diversity and the design of nested core collections. Genome-wide association (GWAS) and genotype-environment association (GEA) analyses will be possible from the project consortium to identify genomic regions involved in climate adaptation. Functional analyses will be performed on the most contrasted populations to finely investigate their responses to cold and warm temperatures. Field experiences of core collections in five countries will allow the validation of favourable alleles under different environmental conditions. All these data will be used (1) to promote local landraces, as several are endangered, and (2) to design crosses that could be relevant to produce pre-breeding populations, each adapted to the climatic evolution of each country.
Supplemental data
Supplemental Table 1. Description of B. oleracea and B. rapa wild populations
Supplemental Table 2 . Description of B. oleracea and B. rapa landraces
Supplemental Table 3. Populations that did not germinate or were misidentifiedAcknowledgements
We thank the Genetic Resource Centers BrACySol (https://igepp.rennes.hub.inrae.fr/l-igepp/plateformes/bracysol) and the Agricultural Institute of Slovenia (https://www.kis.si/en/) for providing seeds from different landraces. We thank Biogenouest (the western French network of technology core facilities in life sciences and the environment, supported by the Conseil Regional des Pays de la Loire) for access to molecular cytogenetics (https://www6.rennes.inrae.fr/igepp_eng/About-IGEPP/Platforms/Molecular-Cytogenetics-Platform-PCMV) and GenOuest bioinformatic platforms (https://www.genouest.org/). We thank Plant imaging platform PHENOTIC in Angers (INRAE-IRHS, Angers University, Institut Agro, GEVES, France) for experiments on seed germination and V. Blouin for tetrazolium staining. We also thank all the staff who took care of our plant material (especially L. Charlon, J-P. Constantin and F. Letertre).
All the research is funded by H2020 Prima, project no. 1425, BrasExplor (https://brasexplor.hub.inrae.fr/) for ‘Wide exploration of genetic diversity in Brassica species for sustainable crop production’ and by INRAE through TSARA Initiative (Transforming food systems and agriculture through a partnership research with Africa) promoting a specific French-Algerian collaboration.
Author contributions
CF, HH, and AMC designed and managed all the experiments. CF, HH, FA, CB, GB, LB, MC, GD, JFC, LG, AG, RI, VI, JAJ, VM, EO, MP, MP, BP, TR, FR, JR, RS, LS, VT, ST, IT, FWB, AMC participated to the collects and the local description of the populations. VM, BP, VR, ST provided landraces and their description from BRC. MT performed flow cytometer analyses. GD and MRG designed chloroplast markers and performed experiments. OC and VH performed all molecular cytogenetic experiments. MB managed the database for population description. CF, HH, MRG and MT contributed to writing the manuscript, which was finalized by AMC.
Conflict of interest statement
The authors declare that they have no financial or competing interests.