Isolation and Characterization of Fifteen Microsatellite Loci for the Use in Breeding of Gmelina arborea Roxb. (Lamiaceae)
Abstract
Gmelina arborea (melina) is a valuable tree species throughout tropical areas, and there are extensive commercial plantations of this species in Southeast Asia, West Africa, and Latin America. As part of a research program for the genetic improvement and management of G. arborea at Instituto Tecnólogico de Costa Rica, we developed, validated, and optimized fifteen microsatellite loci. We used 23 clones belonging to five different companies currently using clonal selection to manage their commercial plantations. Our results showed that all fifteen loci were polymorphic and together had 75 alleles (2-7 alleles/locus). We also found that eleven loci showed lower heterozygosity than expected under Hardy-Weinberg equilibrium (HWE). We calculated the genetic similarity among all clone pairs using the number of shared alleles to examine the potential of these loci for clone discrimination. Overall, pairwise similarity among clones ranged from 0.36 to 0.83, and our findings also showed that clones from the same commercial plantation tended to be more similar to each other than to clones from other plantations. These microsatellite loci will contribute toward the characterization of the genetic diversity, the identification of elite clone lines for timber production, and breeding and adequate management of commercial plantations of G. arborea.
Keywords
breeding, clonal forestry, gene markers, melina, population genetics
Author contributions
O.J.R. and O.M-B. contributed to the conception and design of the submitted manuscript. O.J.R. isolated and developed the fifteen microsatellite loci, D.M-A and F.R-P. validated and optimized each of the fifteen polymorphic loci. O.J.R. drafted the manuscript, and all authors contributed the drafting, revision, and final approval of the submitted manuscript.
Conflict of interest statement
The Authors declare no conflict of interest.
Introduction
Gmelina arborea (melina) is a valuable timber species that grows throughout tropical areas. Native to Southeast Asia and India, it is an important commercial timber species in tropical regions worldwide, particularly in Southeast Asia, West Africa, and South America, where G. arborea is grown in large plantations. Its low-density wood is durable and yields reasonable quantities of relatively uniform, stable, and light color pulp (Dvorak, 2004; Wee, Li, Dvorak, & Hong, 2012). The Panel of Experts on Forest Genetic Resources of the Food and Agriculture Organization (FAO) describes G. arborea as an important tree species with high potential and utility (Lauridsen & Kjaer, 2002).
G. arborea is the second most planted timber species in Costa Rica because of its rapid growth rate, easy establishment, high productivity, a wide range of tolerance to site conditions and excellent regrowth capacity (Rosero, Argout, Ruiz, & Teran, 2011; Vergara, Mercado, Jarma, & Gatti, 2017; Ávila-Arias, Murillo-Cruz, & Murillo-Gamboa, 2015; Ávila-Arias, Murillo-Cruz, Murillo-Gamboa, & Sandoval-Sandoval, 2015). This species was first introduced into Costa Rica in 1966 for pulp production by the local paper company and to serve as a seed source for the establishment of plantations in the Jari Project in Brazil in Eastern Amazonia (Lega-Rounda, 1988). This initial introduction consisted of seeds from twenty independent origins, i.e., provenances from different regions throughout its native range in Asia (India, Pakistan, and Bangladesh), and commercial plantations in Africa (Nigeria and Cameroon) and British Honduras (now Belize). These provenances were planted separately in >100 ha blocks, to provide a broad base for genetic improvement. More than 20 years later, seeds from this plantation were collected from healthy trees with desirable phenotypes, initiating its spread throughout the region.
Breeding efforts of G. arborea in Costa Rica started in the early '90s, leading to the development of highly productive genetic stock for timber production at a regional scale (Ávila-Arias et al., 2015; Ávila-Arias, Murillo-Cruz, Murillo-Gamboa, & Sandoval-Sandoval, 2014; Ávila-Arias et al., 2015). The most successful melina breeding programs in the region use clonal propagation to establish their commercial plantation, as this strategy provides a reliable stock of propagules that are easy to produce and plant and results in fast-growing trees and high productivity. Moreover, researchers have used variables such as trade volume and quality of wood and other indicators of each clone line's performance for the selection of the genetic stock to be planted in sites with different soil characteristics, flooding, and land use-history (Ávila-Arias et al., 2015; Ávila-Arias et al., 2015).
Here, we describe fifteen microsatellite loci developed to support ongoing breeding programs of melina in Costa Rica using a small number of clones selected for their rapid growth and high productivity. These markers will be used for clone identification and potentially for marker-assisted breeding of G. arborea.
Materials and Methods
Development of Microsatellite Markers
The microsatellite markers were developed using the magnetic bead protocol described byCullings (1992) and (Li, Huang, & Brown, 1997) and modified byGlenn and Schable (2005). Genomic DNA from a sample of five G. arborea trees was digested using HaeIII/PshA1 restriction enzymes (Invitrogen; Carlsbad, CA). Two linkers were added to the digested genomic DNA (M28 5’CTCTTGCTTGAATTCGGACTA 3’ and M29 5’pTAGTCCGAATTCAAGCAAGAGCACA 3’) and M28 was used as a primer for subsequent polymerase chain reactions (PCR). Finally, the digested genomic DNA was amplified in multiple PCR reactions and their product concentrated to gain enough DNA for the following bead hybridization process.
Two arbitrary repeat motifs (CA20 and AG17) were selected as probes for the bead hybridization reactions based uponCardle et al. (2000). The short tandem repeat (STR) probes from Integrated DNA Technologies (Coralville, IA, USA) had a biotin label on the 5’ end. The STR probes were added to a bead hybridization reaction to select for DNA fragments that contained the repeat motif of the probe. This bead hybridization process aimed to allow the fragments containing repeats to anneal to the biotin-labeled probes. After the hybridization, the selected fragments were isolated from the rest of the genomic DNA using streptavidin-coated magnetic beads, which bind to the biotin-labeled probes. These fragments were then eluted and re-amplified using the M28 primer in additional PCR reactions. The bead hybridization and PCR pre-amplification processes were repeated one more time to enrich for genomic DNA containing the selected repeats.
After completing the bead hybridization and selection process, the repeat sequences enriched DNA was ligated into a pGEM-T vector from Promega (Madison, WI, USA) to begin the sequencing phase of this protocol. We cloned the vectors into electrocompetent Escherichia coli cells. We later plated transformed E. coli cells onto selective media containing 0.1 mg/mL ampicillin, 0.05 mg/mL X-Gal, and 1mM IPTG. All positive clones were sequenced on an ABI PRISM 377 DNA Sequencer using universal M13 forward (F) and reverse (R) primers (Schuelke, 2000). The sequencing reactions were standard 20 ml reactions using the ABI PRISM BigDye Terminator sequencing kits (Applied Biosystems, Foster City, CA, USA) and 3.2 pmol of PCR product for the template. Primers for each of the fifteen microsatellite loci were designed from sequences containing multiple copies of the repeated motif and with sufficiently long flanking regions on the 5’ and the 3’ end of the repeated region pairs using Primer 3.0 software (Rozen & Skaletsky, 2000).
Microsatellite Loci Characterization
All primer pairs were tested for amplification and polymorphism using DNA obtained from 23 promising genotypes (clones) of G. arborea belonging to five different privately operated clonal breeding programs. Two ramets from each clone were gathered from a clonal collection maintained in a greenhouse at the Instituto Tecnológico de Costa Rica to validate all alleles by genotyping them separately. As described above (Doyle & Doyle, 1987; Lodhi, Ye, Weeden, & Reisch, 1994), total genomic DNA was extracted at the Forest Molecular Genetic Laboratory, in the Forest Innovation Research Center (CIF) at the Instituto Tecnológico de Costa Rica, Cartago, Costa Rica. Copies of these clones are maintained in the mini clonal garden facility and could be made accessible upon request.
PCR Amplification and Fragment Analysis
Polymerase chain reactions were performed in a final volume of 15 μl, containing approximately 50 ng of genomic DNA, 10 mM Tris buffer, pH 8.0, 10 mM MgCl2, 0.2 mM dNTPs, 0.4 μM of each primer, and 1 U of Taq polymerase (Fermentas®) using an Eppendorf® Mastercycler EP thermal cycler. The PCR program used included an initial step of 2 min of denaturation at 94 °C, 30 cycles of 15 s at 94 °C, 15 s at 55 °C and 30 s at 72 °C, and a final extension cycle of 1 min at 72 °C. To genotype each individual, we conducted electrophoresis for fragment separation using a QIAxcel Advanced fragment analyzer from QIAGEN® at Centro de Investigación en Biología Celular y Molecular (CIBCM) at Universidad de Costa Rica. Once all of the data scorings were complete, random samples were re-amplified and re-ran to assess reproducibility and confirm scoring and allele sizes.
Genetic analysis
GenAlex 6.3 (Peakall & Smouse, 2006) was used to calculate common indicators of genetic diversity, including the number of alleles (Na) per locus and the expected (He) and observed heterozygosity (Ho). GenAlex was also used to calculate deviations from Hardy–Weinberg equilibrium (HWE) and linkage disequilibrium. Genotype errors due to stutter bands, allele dropout, and null alleles were estimated using the MICRO-CHECKER software (Oosterhout, Hutchinson, Wills, & Shipley, 2004).
To examine the potential of these loci for discrimination among the 23 clones, the multilocus genotype of each clone was determined using the presence and absence of alleles to estimate genetic similarities for all pairwise comparisons among clones. Genetic similarity among each pair of clones was calculated based on the number of alleles common among the clones according to the following equation proposed by Dice (1945), where , where a is the number of alleles common to clones x and y, b the number of alleles present only in clone x, and c the number of alleles present only in clone y. A cluster analysis based on sequential, agglomerative, hierarchical, and nested clustering methods (SAHN, UPGMA; NTSYS-pc-p package; (Rohlf, 1993) was conducted to describe the relationship between the clones.
Results
Microsatellite loci
Table 1 lists the loci names, corresponding accession numbers in Genbank, repeated motifs, forward and reverse primer sequences, the size range of PCR products, and annealing temperatures for each of the fifteen microsatellite loci isolated for Gmelina arborea. All loci were polymorphic, with the number of alleles per locus ranging from 2 to 7 (Table 2). We found 75 different alleles across all loci (Supplemental Table 1), with an average of 5.00 ± 0.41 alleles per locus. Average observed and expected heterozygosities were also high (Ho = 0.504 and He =0.645, Table 2). Moreover, our findings did not show evidence of scoring error due to stuttering or significant allele dropout for any of the fifteen polymorphic loci.
|
Locus name |
Accession no. |
Repeat motif |
Primer sequence |
Range of PCR products (bp) |
Annealing Temp (°C) |
|---|---|---|---|---|---|
|
Meldi1 |
MH249250 |
CT12 |
R: 5'-CCCCACTTTTGATGCTCTCT-3' |
113-131 |
56 |
|
F: 5'-TAGTTGGTGAAATGAAAATTCGC-3' |
|||||
|
Meldi2 |
MH230082 |
TC9.GA15.GA9 |
R: 5'-TAGTCGCATAAGGAAAAGTTAG-3' |
299-317 |
55 |
|
F: 5'-CCAATTCTGTGCTGCTAAGG-3' |
|||||
|
Meldi4 |
MH249251 |
TC17 |
R: 5'-ACTCCAGACCTTTCTCGCTC-3' |
214-237 |
58 |
|
F: 5'-CCTTCTTCAAAATCCGATCTTTC-3' |
|||||
|
Meldi5 |
MH249252 |
GA10 |
R: 5'-CAATTTCCTTCAGTTATTCCCAC-3' |
283-307 |
50.8 |
|
F: 5'-CAAAATAGATTAAGCCCACATC-3' |
|||||
|
Meldi6 |
MH249253 |
TC12TC9.TC10 |
R: 5'-CCCATATCACCTGCTCTTAG-3' |
292-320 |
56 |
|
F: 5'-GGATGTCACGATGTCGGATG-3' |
|||||
|
Meldi7 |
MH249255 MH249254 |
CT22…CT19 |
R: 5'-CCTAACAATCATGGAAAAGAG-3' |
352-376 |
54 |
|
F: 5'-CACTCAGCGTGGCAAAGAG-3' |
|||||
|
Meldi10 |
MH249256 |
CT19 |
R: 5'-CAATTTCTCCCTAGCAAGTTC-3' |
174-210 |
56 |
|
F: 5'-AGTACATCTACTCAAAGGAGGT-3' |
|||||
|
Meldi11 |
MH249257 |
GA12 |
R: 5'-GCTTGTGGTTTGGGTGACGA-3' |
168-182 |
57 |
|
F: 5'-AGTGATGCTCCTCATTCAGGA-3' |
|||||
|
Meldi11.2 |
MH249257 |
TC9 |
R: 5'-TTCATAATGAGCAAAGGGGAC-3' |
140-160 |
56 |
|
F: 5'-GGCCACTTCAGTATCCACAC-3' |
|||||
|
Meldi12 |
MH249258 |
TC15 |
R: 5'-CCTAGATTAGCCATTTATATTG-3' |
206-214 |
56 |
|
F: 5'-GGTGGAGCAGAAGAAGAGAGA-3' |
|||||
|
Meldi16 |
MH249260 |
TG23 |
R: 5'-ACCAGGACACCCTCGACAC-3' |
213-225 |
55.2 |
|
F: 5'-GTTGAGGAGCAGTTTATAAGAC-3' |
|||||
|
Meldi17 |
MH249261 |
TG10.GA17 |
R: 5'-GGTTATTATAATCACTTCTGCC-3' |
153-167 |
55 |
|
F: 5'-CCAATGTAATAGGACAAAACTC-3' |
|||||
|
Meldi20 |
MH249263 |
GT8.GA17 |
R: 5'-GGGAAAATCAGATACACTGCC-3' |
205-231 |
57 |
|
F: 5'-ATCAACCAAGGGGACAAGCC-3' |
|||||
|
Meldi21 |
MH249264 |
GA14..TGn |
R: 5'-GCATGCAACAGAGAAAAGAAG-3' |
231-262 |
55 |
|
F: 5'-GATAATCGTACTAAAGTTGAGG-3' |
|||||
|
Meldi24 |
MH249267 |
CA6..GA17 |
R: 5'-CCTTTCCCTAAGTCCACACA-3' |
211-219 |
53 |
|
F: 5'-TTTTGTCCAAATGAGGCTCC-3' |
|
|
Number |
Heterozygosity |
χ² test |
T est for Null Alleles |
|
|
Locus name |
of alleles |
Observed |
Expected |
P-value |
P-value |
|
Meldi1 |
3 |
0.435 |
0.446 |
ns |
† |
|
Meldi2 |
5 |
0.348 |
0.712 |
*** |
*** |
|
Meldi4 |
6 |
0.652 |
0.671 |
ns |
† |
|
Meldi5 |
6 |
0.652 |
0.750 |
** |
ns |
|
Meldi6 |
7 |
0.217 |
0.774 |
*** |
*** |
|
Meldi7 |
7 |
0.550 |
0.839 |
*** |
** |
|
Meldi10 |
6 |
0.435 |
0.722 |
*** |
** |
|
Meldi11 |
3 |
0.227 |
0.404 |
*** |
† |
|
Meldi11.2 |
6 |
0.500 |
0.792 |
* |
** |
|
Meldi12 |
2 |
0.609 |
0.423 |
* |
† |
|
Meldi16 |
3 |
0.565 |
0.542 |
* |
† |
|
Meldi17 |
4 |
0.348 |
0.661 |
*** |
*** |
|
Meldi20 |
6 |
0.522 |
0.705 |
ns |
* |
|
Meldi21 |
5 |
0.435 |
0.746 |
*** |
** |
|
Meldi24 |
6 |
0.435 |
0.775 |
*** |
*** |
Our analyses revealed significant deviations from Hardy-Weinberg proportion in most loci (Table 2). We observed heterozygote deficiencies in eleven loci and an excess of heterozygotes in one locus (Meldi-12; Table 2). However, given the small sample size used to validate these loci and the high number of alleles found in most of them, it is reasonable to expect that they will not be in Hardy-Weinberg equilibrium (HWE). Moreover, the clones used to validate these microsatellite loci do not represent a sample of a natural population of G. arborea, but a collection of promising genotypes selected by the timber industry. We also caution that two loci; namely, Meldi11 and Meldi11.2, which include different tandem repeats, were derived from the same sequence.
Our analysis using the software MICRO-CHECKER did not reveal evidence for genotype errors due to stutter bands or allele dropout. Our analysis suggested the presence of null alleles in nine loci (Table 2), but such findings might result from a deviation from Hardy-Weinberg proportions. MICRO-CHECKER uses deviations of Hardy-Weinberg proportions to identify loci likely to have null alleles. We need to reiterate that our sample did not represent a natural population of G. arborea. For that reason, deviations from Hardy-Weinberg proportions are likely to occur in multiple loci.
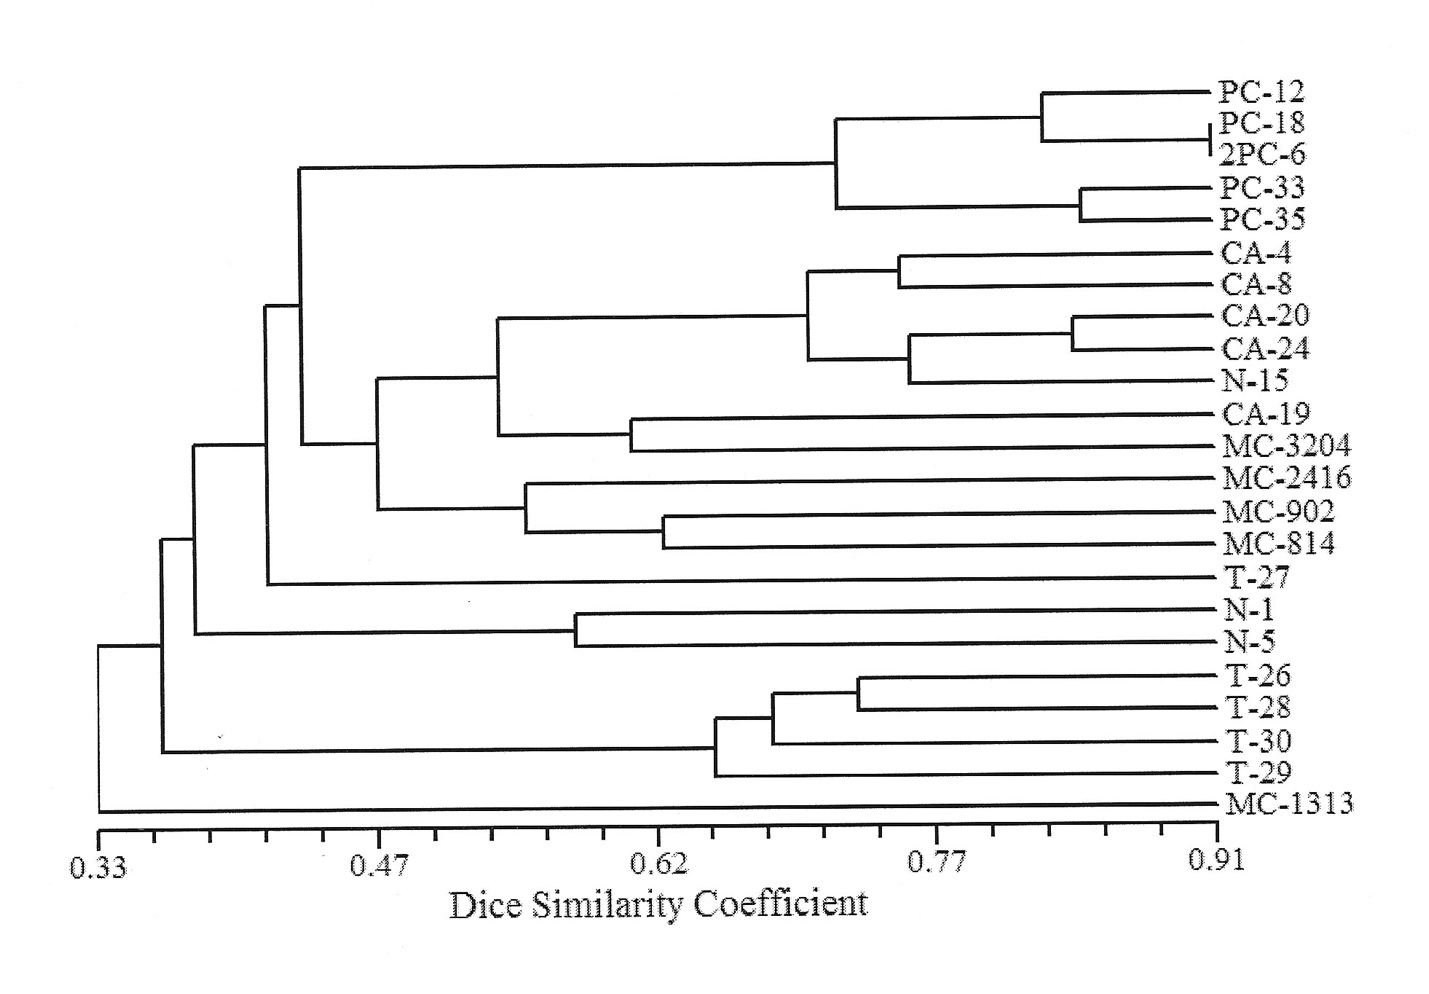
Our results also showed that all 23 clones exhibited a unique combination of alleles (Supplemental Table 1), resulting in genetic similarities (Dice) ranging from 0.36 to 0.83 (Figure 1). Overall, most of the clones clustered according to their origin or breeding program. All clones from programs PC and CA clustered together while some clones from programs MC, N, and T grouped with clones from the other programs.
Discussion
We described fifteen polymorphic microsatellite loci for the fast-growing timber tree Gmelina arborea. These new microsatellite loci proved to be very informative, accurate, and with a reliable discrimination power for assessing genotype identity. The process of allele validation provides confidence for utilizing this set of microsatellite loci for multiple purposes. Overall, we found high levels of allelic diversity, suggesting a broad genetic base in the original material from which these 23 clones were selected. We expected to encounter high genetic diversity among the clones used in this study because they represent a sample taken from collections of G. arborea selected by growers because of their performance. Moreover, the plantations where these clones were selected have different soil types, precipitation regimes, and topography.
We found that all clones from two clonal breeding programs clustered together in the dendrogram (PC and AC; Figure 1). However, this is not true for clones from all breeding programs, as clones from the same program may not group in the same cluster. For example, clone T-27 did not cluster together with the other four genotypes in the same program (T-26, T-28, T-29, and T-30). Similarly, clones N-15 and MC-1313 did not group with the other trees from their program. However, clones from the same breeding program tended to group, suggesting that the process of selecting promising clones, based on what breeders considered desirable phenotypes, varies among breeding programs. Furthermore, this finding also implies that promising clone lines could perform well in a given environment. Therefore, it suggests that the degree of similarity of allelic composition among clones may indicate similarities in their ability to respond to environmental conditions.
(Ávila-Arias et al., 2014) conducted a field trial using different clone lines planted in two locations in southwestern Costa Rica. They found significant differences in diameter at breast height (DBH), commercial height, commercial volume of the trunk over bark, trunk quality, and the volume and quality of the wood among clone lines two years after planting. Their analysis also showed significant genotype by environment interaction in clonal performance, as some accessions grew well in their site of origin but not in other locations. (Murillo-Gamboa, Salas-Rodríguez, Murillo-Cruz, & Ávila-Arias, 2016) reported differences in the tolerance to melina’s wilt, a critical disease in Costa Rica, among clone lines used in the field trial conducted by (Ávila-Arias et al., 2015; Ávila-Arias et al., 2015). These findings indicate that clone selection is biased toward genotypes performing well in particular environments, thus suggesting that genetic markers could play a role in identifying promising genotypes.
In summary, the fifteen polymorphic microsatellite markers we described here have great potential use for the breeding of G. arborea, including genotyping the breeding collections, as well as keeping the identity and assessing the purity in clonal gardens. In this respect, there are eleven additional loci available to expand the multilocus genotype of each clonal line (Liao, Li, Qi, & Hong, 2010) to increase the possibilities for genetic analysis and marker-assisted selection of G. arborea.
Acknowledgements
This work was supported by the Fundación CR-USA, the Department of Biological Sciences of Kent State University and Instituto Tecnológico de Costa Rica.
Supplemental data
Supplemental Table 1: Alleles observed in each of the 23 clones of Gmelina arborea. Summary of the presence (1) or absence (0) of the 75 alleles found in the fifteen polymorphic microsatellite loci in each clone. This information was used to estimate genetic similarities for all pairwise comparisons among clones